Short cut methods have been used to design fracionators for many decades. They were developed to make it possible to get rough estgimates for the number of ideal stages required to achieve a separation for any given reflux conditions in a column. Simplifications used in the approximations include the assumption of constant relative volatilities of the compounds and constant molar flow rates in each section of a column. Although these condition are rarely encountered in real systems, the estimate prove to be useful even now as a starting point in the design of columns. We will see in this section of the notes how they might be used in the design of a set of fractionators used to separate a mixture of the three compounds analysed in the sections on the use of Matlab in flash and bubble point determination and then the use of Aspen for comparison with several thermo packages.
The following links may be followed to different parts of this chapter:
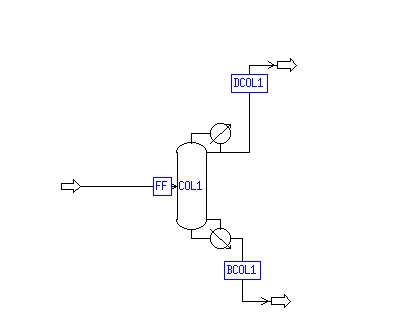
We will attempt to separate a mixture the is 35 mol % acetone, 40 mol % methanol and the ramainer isopropanol into products that are 98 mol % in each of the three compounds. First let's look at what we can get from the separation of the mixture using a single DSTWU module in Aspen. The flow diagram looks like:

The compounds and the feed stream are then specified as usual in an Aspen simulation. The Wilson property package is chosen since that was found to give results closest to the experimental data. Here is the main part of the compounds data file.

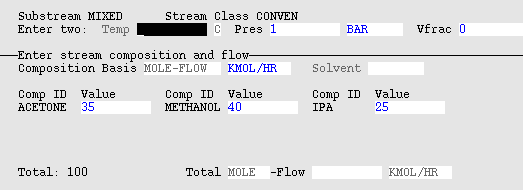
Here are the specifications for the feed stream.
The input file for the DSTWU module requires that you specify the following:

Most of these specifications are simple, but they require some care. I chose to specify the number of stages in this first simulation since that was easier to guess than the require reflux ratio. We might be tempted to try to get a product that is 98 mol % acetone, but a TXY diagram for acetone-methanol shows definite azeotropes at most pressures that might be used for the columen. Here is what we find for 1 bar and 5 bar.
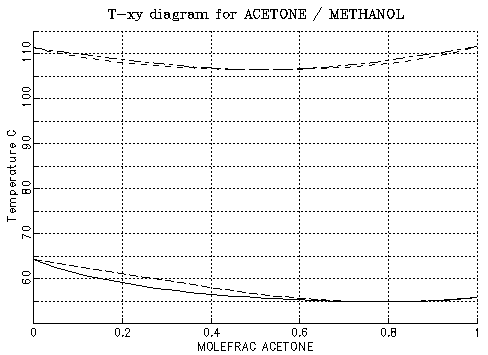
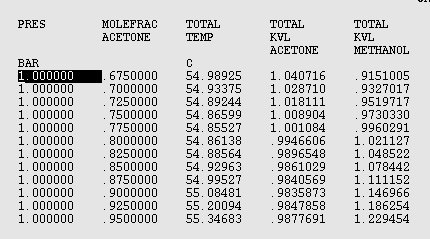
Fortunately the TXY curves show that the azeotrpic mixture composition changes significantly with pressure. This can be found more accurately in the tables that are generated with the plots. We can see from the following part of the table that the azeoptropic compostion at one bar is very close to 0.775 mol fraction acetone.
The azeotrope at 5 bar occurs close to 0.5 mol fraction acetone as seen in an abstract from the table:
       5.000000    .4750000    106.5505    1.023146    .9789565
       5.000000    .5000000    106.5304    1.008500    .9914128
       5.000000    .5250000    106.5285    .9951909    1.005246
. When we run the simulation, we find:
================================================================================
Data file created by ASPEN PLUS Rel. 9.3-1  on  14:33:48 Mon Nov 3, 1997
Run ID: SCEX1 Item: STREAM-SUM Screen: Stream-Sum.Main
C-----------C-----------C----------C----------C----------C----------C-----------

 Display ALLSTREAMS    BCOL1      DCOL1      FF
 Units:           From COL1       COL1
 Format: GEN_M    To                         COL1
                  Phas LIQUID     LIQUID     LIQUID
 Temperature [C]             67.1       54.9       59.7
 Pressure    [BAR]          1.100      1.000      1.000
 Vapor Frac                 0.000      0.000      0.000
 Mole Flow   [KMOL/HR]     64.950     35.050    100.000
 Mass Flow   [KG/HR]     3010.314   1806.572   4816.886
 Volume Flow [CUM/HR]       4.019      2.394      6.381
 Enthalpy    [MMKCAL/H     -4.092     -2.016     -6.115
 Mole Flow   [KMOL/HR]
   ACETONE                  8.750     26.250     35.000
   METHANOL                31.200      8.800     40.000
   IPA                     25.000                25.000
 Mole Frac
   ACETONE                  0.135      0.749      0.350
   METHANOL                 0.480      0.251      0.400
   IPA                      0.385                 0.250
Note that the azeotrope has a boiling point lower than either acetone or methanol in their pure states. Thus if we operate a column at 5 bar with a feed that is about 0.725 mol fraction acetone, we could produce a product in the bottom that is almost pur acetone. To meet our desired product specifications we might design a three column sequence as shown next:
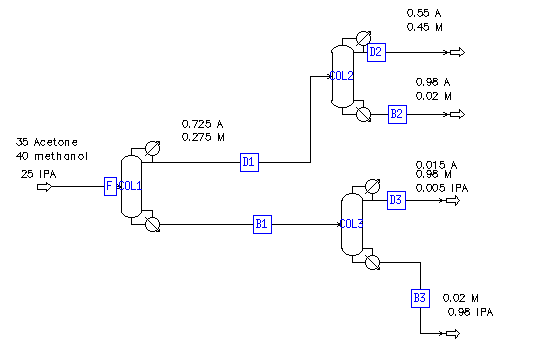
We would do so be operating columns 1 and 3 at close to atmospheric conditions while column 2 is at 5 bar. The two azeotropes in streams D1 and D2 could be adjusted some and the composition of the other distillate might not be exactly as shown since we do not know the ratio of the impurities in D3. The compositions should be reasonably close to what we would need in our separation system. Furthermore a degree of freedom analysis shows that to meet the compositions in the diagram all flows must be determined. There are 4 streams with three compounds in each and three streams with two compounds. We know the three flows in the feed, and 7 compostions are set. We can do three mass balances in columns 1 and 3 and two in column 2. The unknowns total: 18. The specifications and balances total: 18. It looks good. The equations we need to solve to find the flows are linear and can be done simply, but to use DSTWU in each column, we need to find the fraction of each key compound going to the top product. This is simple, but Maple does a better job than hand calculations.
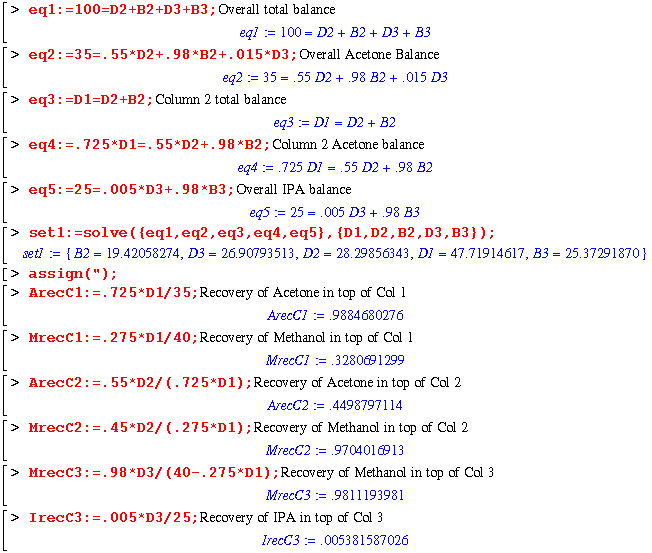
Setting the recoveries shown in the Maple session, we get the following results in our shortcut Aspen session:
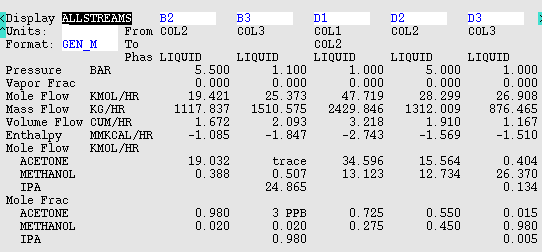
Note that B2 is our Acetone product, B3 is our isopropanol product and D3 is the methanol product. We can see what we need in each column in the next listing from the Dstwu.Results screen:
================================================================================
Data file created by ASPEN PLUS Rel. 9.3-1  on  16:24:52 Fri Oct 31, 1997
Run ID: SCEX3 Item: COL1 Screen: Dstwu.Results
C-----------C-----------C----------C----------C----------C----------C-----------
Description:                                                   Units:

   Convergence Status: Block Completed Normally
   Property Status:    OK

   Minimum Reflux Ratio               1.724154
   Actual Reflux Ratio                2.043051
   Minimum Stages                     37.3
   Actual Equilibrium Stages          74.7
   Number of Actual Stages Above Feed 22.0
   Reboiler Heating Required          1.087473   MMKCAL/HR
   Condenser Cooling Required         1.078100   MMKCAL/HR
   Feed Stage Location                23.0
   Distillate Temperature             54.89457   C
   Bottom Temperature                 72.03703   C
   Distillate Vs Feed                 .4771925
   HETP


================================================================================
Data file created by ASPEN PLUS Rel. 9.3-1  on  16:25:17 Fri Oct 31, 1997
Run ID: SCEX3 Item: COL2 Screen: Dstwu.Results
C-----------C-----------C----------C----------C----------C----------C-----------
Description:                                                   Units:

   Convergence Status: Block Completed Normally
   Property Status:    OK

   Minimum Reflux Ratio               1.484204
   Actual Reflux Ratio                243.2945
   Minimum Stages                     34.8
   Actual Equilibrium Stages          35.0
   Number of Actual Stages Above Feed 16.4
   Reboiler Heating Required          47.14750   MMKCAL/HR
   Condenser Cooling Required         47.05872   MMKCAL/HR
   Feed Stage Location                17.4
   Distillate Temperature             106.5457   C
   Bottom Temperature                 115.1195   C
   Distillate Vs Feed                 .5930231
   HETP


================================================================================
Data file created by ASPEN PLUS Rel. 9.3-1  on  16:25:38 Fri Oct 31, 1997
Run ID: SCEX3 Item: COL3 Screen: Dstwu.Results
C-----------C-----------C----------C----------C----------C----------C-----------
Description:                                                   Units:

   Convergence Status: Block Completed Normally
   Property Status:    OK

   Minimum Reflux Ratio               1.876579
   Actual Reflux Ratio                2.090020
   Minimum Stages                     14.6
   Actual Equilibrium Stages          35.0
   Number of Actual Stages Above Feed 23.0
   Reboiler Heating Required          .7059745   MMKCAL/HR
   Condenser Cooling Required         .7003700   MMKCAL/HR
   Feed Stage Location                24.0
   Distillate Temperature             63.66090   C
   Bottom Temperature                 83.78529   C
   Distillate Vs Feed                 .5146791
   HETP
All of the results shown are reasonable except for those shown for column 2. The reflux ratio is way too high since the number of stages we specified was very close to the minimum. Note that his did not happen in column 1, where the specification of 35 stages was less than the minimum. In that case the simulation used twice the minimum number of stages.
Here is a second attempt at getting a reasonable reflux in column 2. We specify:

And find:
================================================================================
Data file created by ASPEN PLUS Rel. 9.3-1  on  15:37:32 Mon Nov 3, 1997
Run ID: SCEX3 Item: COL2 Screen: Dstwu.Results
C-----------C-----------C----------C----------C----------C----------C-----------
Description:                                                   Units:

   Convergence Status: Block Completed Normally
   Property Status:    OK

   Minimum Reflux Ratio               1.484204
   Actual Reflux Ratio                2.000000
   Minimum Stages                     34.8
   Actual Equilibrium Stages          63.0
   Number of Actual Stages Above Feed 29.5
   Reboiler Heating Required          .6665066   MMKCAL/HR
   Condenser Cooling Required         .5777284   MMKCAL/HR
   Feed Stage Location                30.5
   Distillate Temperature             106.5457   C
   Bottom Temperature                 115.1195   C
   Distillate Vs Feed                 .5930231
   HETP
The following table shows the results found by use of the shortcut methods for the three columns. We will need much of this data in our plate to plate simulation with the RADFRAC module.
|
|
|
|
|
|
|
|
|
|
|
|
|
|
|
|
|
|
|
|
|
|
|
|
|
|
|
|
|
|
|
|
|
|
|
|
|
|
|
|
|
|
|
|
|
|
|
|
|
|
|
|
|
|
|
|
|
|
|
|
|
|
|
|
|
|
|
|
|
|