 |
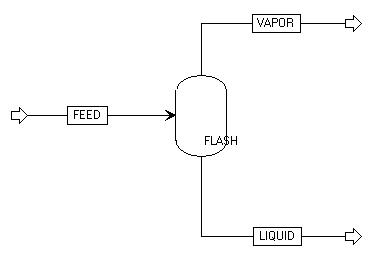
The basic flow diagram that was used to demonstrate creating and executing a model looked like.
|
|
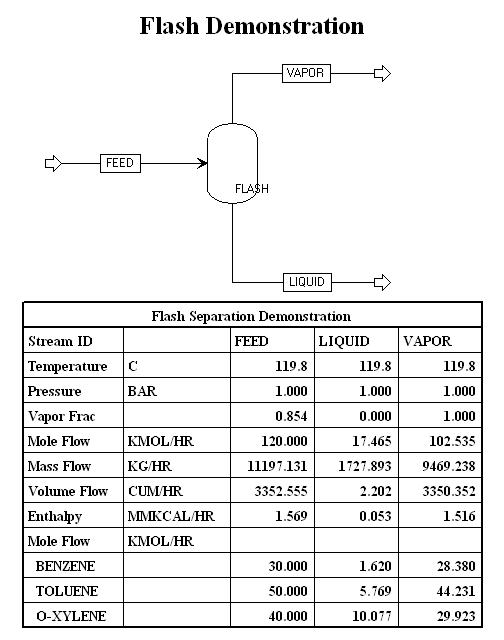
We may add a title (and other text) and a Table of stream data to make the diagram more useful in reports. Here is an example:
 |
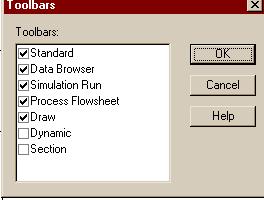
Aspen Help may be very useful in finding out how to annotate you flow diagrams. It may be done in standard or PFD mode. In older versions of Aspen the use of the PFD mode was essential, but it appears to be less useful in Aspen 10.
This will cause the Draw bar to be displayed as a third line of toolbars:
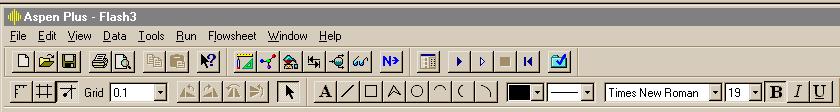
This gives you the standard tools for drawing: for example the A button allows you to enter text that may be made bold, italicized or uderscored with the last three buttons. You can also change the font and size of font with the two selectors preceding those three. You can also draw figures and lines as on most other drawing programs.
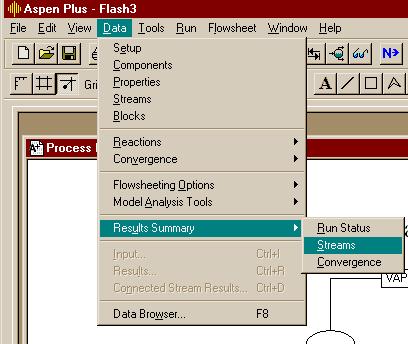
Then you should find the Stream Results Table displayed:
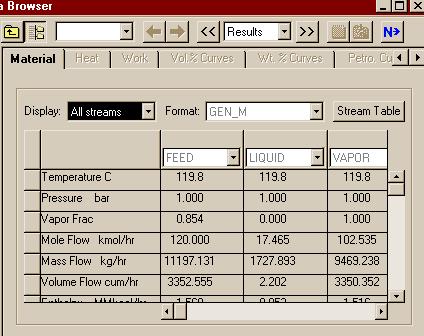
Click the "Stream Table" button to have that table inserted in your diagram.