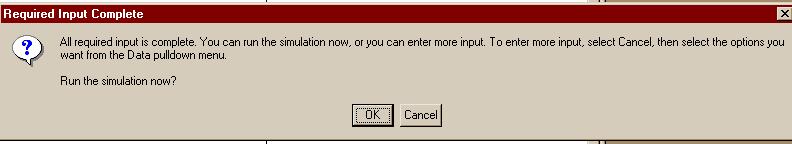
After you have entered all required data for your simulation, the "Next" button will bring up the message:
Clicking the "OK" button will then start execution of the simulation and show the Control Panel:
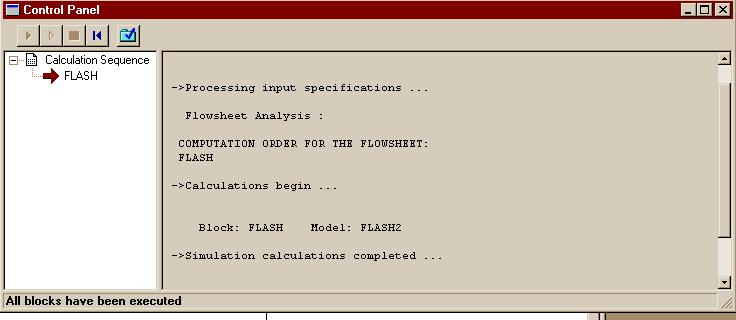
When executing a flowsheet in Aspen, it is wise to view the Control Panel as the run is proceeding. You may execute the simulation with "Run" in the Run menu, but the Control Panel allows you to witness the progress of the run. You may also cancel a run in mid-calculation via the control panel if you wish. Finally, it is also possible to pull up a results window using the Control Panel after calculations are complete.
You may scroll through the Control Panel window to learn more about the status of a run. For example, if the run had crashed, the control panel would have given us a reason for the failure. Keep in mind, though, that the Control Panel does not always give detailed information.
This image of the Control Panel indicates that the run was
successfully completed. To access the results, click on the "Results"
button: ![]() in the Control Panel. If you are not running a Control Panel (you can
always bring one up by using the "View" menu), you may access the
results by choosing the procedure shown in the section on annotating
your diagram.
in the Control Panel. If you are not running a Control Panel (you can
always bring one up by using the "View" menu), you may access the
results by choosing the procedure shown in the section on annotating
your diagram.
When the results page appears, the first information it displays is little more than a cover page. To get to more important data, select "Results Summary - Streams" to see:
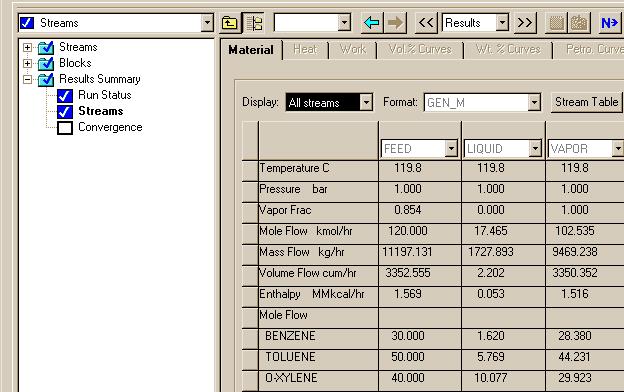
This selection in the Results window summarizes the system's stream data.
If you click on ">>" button next to the window that says "Results", you will move to other sections of the Results. For instance, clicking on ">>" several additional times yields the following window:
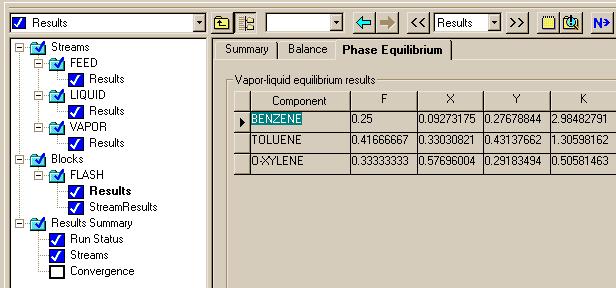
This window is important in that it provides the same information that is found by modeling a flash tank with the Matlab software.