The analysis described in the section on shortcut methods was used as a starting point for a more rigorous simulation using the RADFRAC modules in Aspen. Our objective was to produce thrre product streams with each product 98 mol% purity in one of comounds in the feed. We will show first what we found using the parameters for each column predicted by the shrtcut analysis. Then we will adjust those parameters to meet the product specifications while cutting down on the column sizes. We will conclude with a comparison of the design parameters found for the three cases:
In the first try of this simulation, column 1 did not converge in 25 iterations. I increased the number of iterations to 50, but that did not help. I then tried another Convergence method: NEWTON and all three columns converged in less than 25 tries.
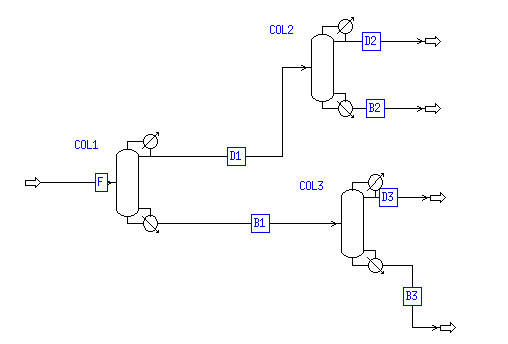
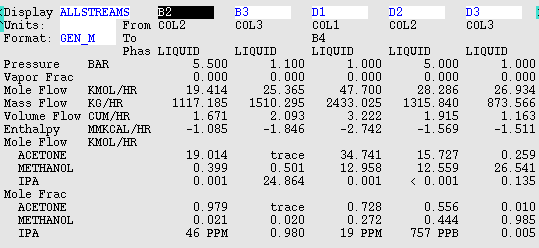
Here is a stream table after convergence was achieved. It shows the three product streams: B2, B3, and D3. It is obvious that the acetone and isopropanol products do not meet the specifications.
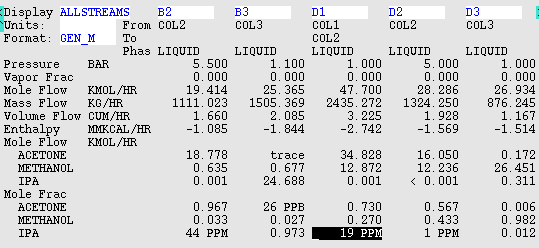
The flow diagram was next modified to include a pump between Columns 1 and 2 to increase the pressure to 5 bar in the second column. Without this pump the simulation gave produced a WARNIG, but it still gave the same results as found with the pump in place. The following flow diagram shows the modified system and the main components in each product.
In order to get better products, the reflux ratios in Columns 2 and 3 were increased to 2.2 and 2.35 respectively. The number of stages was also increased in column 2. This gave the following flow table:
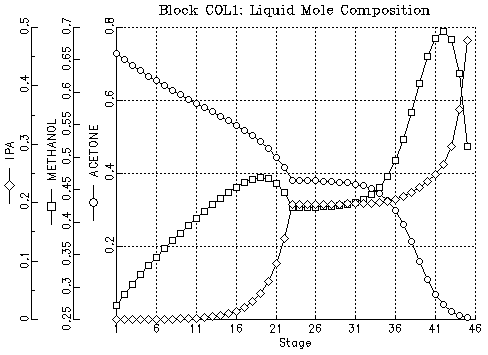
This gave almost exactly the desired purity for the acetone and isopropanol, but a higher than needed methanol purity. A look at the composition changes with plate number in the three columns showed that two of the columns had many plates that were not needed. Here is column 1:
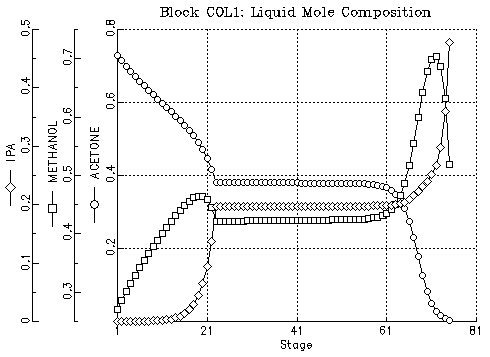
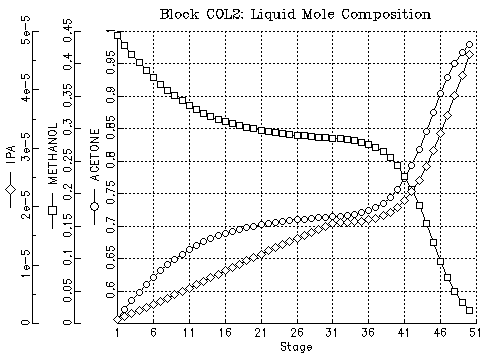
At least 30 stages in the bottom part of the column produce almost no changes in composition. Here is column 2:
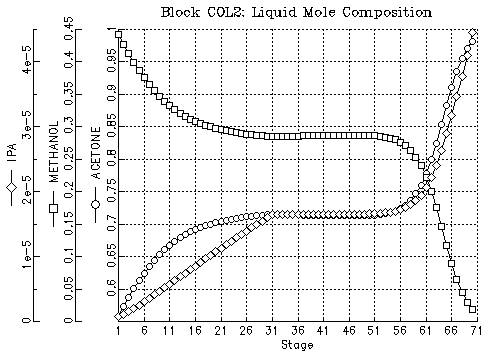
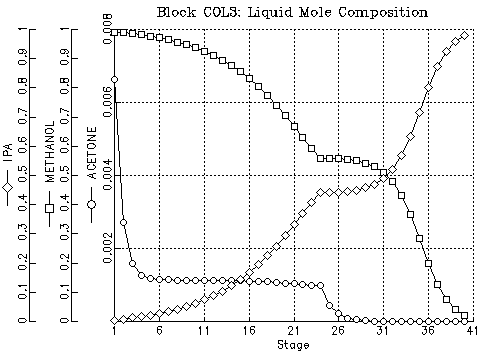
It looks like we could eliminate 20 stages in column 2. On the other hand, column 3 looks pretty good:
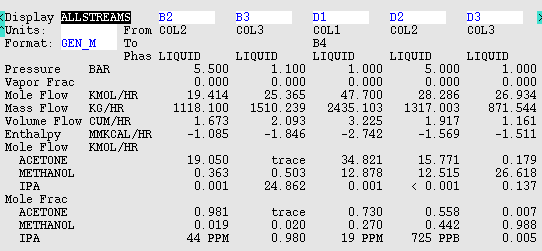
Here is the flow table after eliminating the unneeded stages in columns 1 and 2.
We don't quite meet the Acetone specification, but it is very close. We still make a methanol product that is purer than needed. Here is the way the composition now changes in column 1:
We might still reduce the number of stages a little. Column 2 now looks pretty good.
Here are the main results of the rigorous simulations in the same format as shown in the chapter on the Short Cut methods. The green results were found in the first execution of the RADFRAC simulation. The yellow results were found after making final adjustments in the column size.
|
|
|
|
|
|
|
|
|
|
|
|
|
|
|
|
|
|
|
|
|
|
|
|
|
|
|
|
|
|
|
|
|
|
|
|
|
|
|
|
|
|
|
|
|
|
|
|
|
|
|
|
|
|
|
|
|
|
|
|
|
|
|
|
|
|
|
|
|
|