Example 1 - Analysis of the Network Using entHC1 and entHC
Here is what help tells us about the program entHC1:
>>help entHC1

  The enthalpy of one or more streams with different FCp.
  function H=entHC1(T,FC)
  Argument  Holds                                  Size
     T      Temps. where FCp changes           1 row   N+1 columns
     FC     Value of FCp for T in an interval  1 row   N columns
  The returned row vector H gives the enthalpy relative to the value
     at T(1) for each of the Ts.   Thus H(1) is always 0.
  Example: >> Thot=[100 120 200 250];
           >> FChot=[4000 5000 1000];
           >> Hhot=entHC1(Thot,FChot)
Using entHC1 on the hot streams gives:
>>Thot=[25 50 200 275];
>>FChot=[0.15 0.46 0.15];
>>Hhot=entHC1(Thot,FChot)
Hhot =
         0    3.7500   72.7500   84.0000
On the cold streams, we find:
>>Tcold=[25 100 200 250];
>>FCcold=[0.2 0.5 0.3];
>>Hcold=entHC1(Tcold,FCcold)
Hcold =
     0    15    65    80
>>help entHC
Uses entHC1 to produce composite curves and plot them with a
horizontal shift
function entHC(Thot,FChot,Tcold,FCcold,Tunit,Hunit)
Argument Holds Size
Thot Temps. where FCp changes for hot fluid 1 row N+1 columns
FChot Value of FCp for Thot in an interval 1 row N columns
Tcold Temps. where FCp changes for cold fluid 1 row M+1 columns
FCcold Value of Fcp for Tcold in an interval 1 row M columns
Tunit Units for T: character data
Hunit Units for enthalpy: character data
Uses entHC1
Example: >> Thot=[100 120 200 250];
>> FChot=[4000 5000 1000];
>> Tcold=[90 130 150 190];
>> FCcold=[3000 9000 6000];
>> entHC(Thot,FChot,Tcold,FCcold,'F','Btu/hr')
>>
entHC(Thot,FChot,Tcold,FCcold,'C','MW')
If you want to print the current graph, reply: y
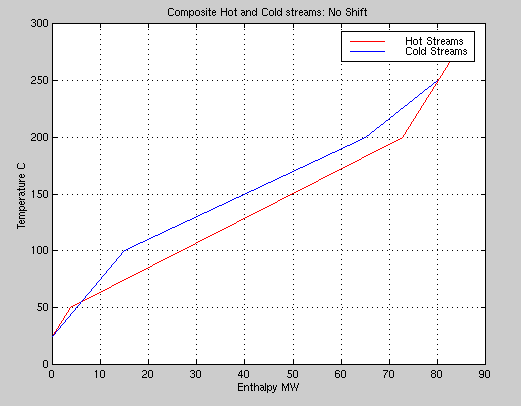
Here is the graph:

|
Since most of the cold stream curve lies above the hot stream, we will have to shift the cold curve to be able to transfer heat from hot to cold. If we tell the program we do not want to print that curve:
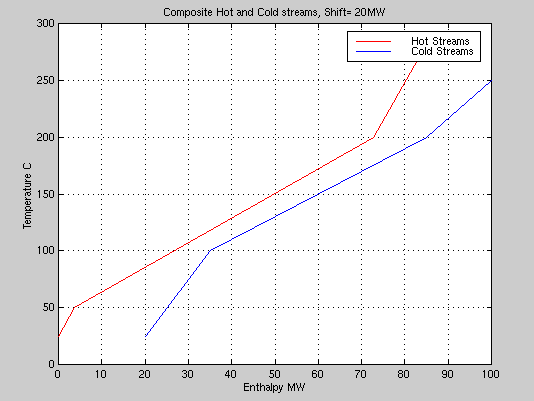
Give a new shift or 0 to stop.  20  <-- We will need that much.

If you want to print the current graph, reply: y

|
This will give at least 15°C difference in temperature between the hot and cold streams at all points. Note that if we operate with this shift, we will need to use utilities for removing 20 MW of heat from the hot streams since there is no cold fluid that could be used Similarly we need to add 15 MW of heat to the cold streams.
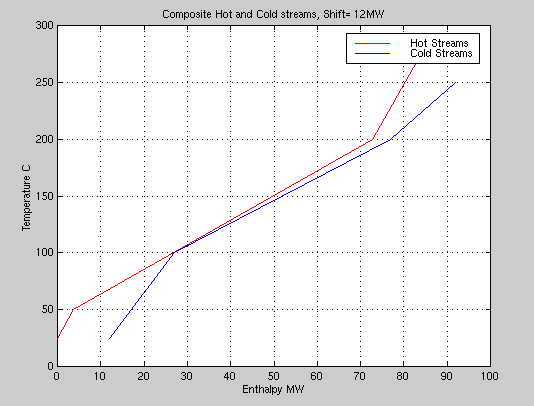
A smaller shift will produce:

|
A shift of 12 MW, produces a borderline feasible exchanger network. As Smith explains, a 10°C minimum temperature difference is normally required. We saw in the demonstration of heat exchanger simulators, that for too small a difference, we can not use multiple pass exchangers. This is true of other realistic exchangers where cross flow can have much the same influence as the co-current flow in a multiple pass exchanger.
The composite curves give "targets" for the minimum amount of heat that will have to be transferred to and from utilities. The curves generated by several shifts show that:
| Shift (MW) | DTmin (°C)3 | Cooling Utility (MW) | Heating Utility (MW) |
|---|---|---|---|
| 12 | ~0 | 12 | 8 |
| 16.35 | 10 | 16.35 | 12.35 |
| 20 | ~15 | 20 | 16 |
| 20.95 | 20 | 20.95 | 16.95 |
3For shifts of 12 and 20, the DTmin were read from the graphs. The other two shifts were calculated for specified DTmin.
As the minimum temperature difference increases, the exchanger size (area) required decreases, but this requires higher utility usage. Note that for all cases, the difference between the heating and cooling utility is the same: 4 MW more cooling is required than heating.
If we wish to construct an exchanger network that meets the minimum temperature difference of 10°C temperature difference, we will find that the number of exchangers required to meet the minimum utilities specification is large. Douglas has a detailed discussion of this topic. He found that for a very similar problem 7 heat exchanges were needed. Two of these are used for exchanging heat with the utilities and the other five for exchanging heat between the hot and cold streams.