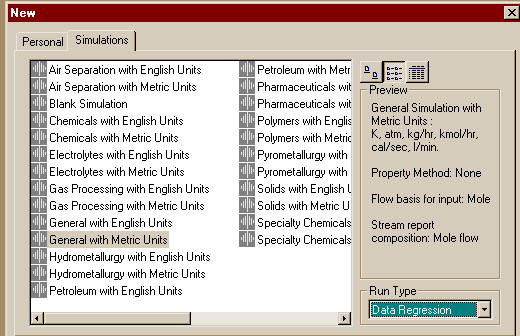
This section of the notes will illustrate the use of Aspen's Data Regression System to find parameters in the Van Laar thermodynaics package to fit experimental VLE data for the Acetone-Methanol-Isopropyl Alcohol system. Details about the use of this system may be found in Volume 2, Chapter 31 of the Aspen Manual. As in the other Aspen session you Start from the Programs for the Design Class. An aspen window will appear and you should choose to start a new simulation using a Template so you can choose the Application type and Run type. I chose to use Metric Units and in our application we will be doing a "Run Type" Data Regression as seen below:

Clicking on the OK button will show us the normal Aspen working window, but if you try to find out what to do with the Next button, you get:

Tel it OK again to get the Setup.Main form:
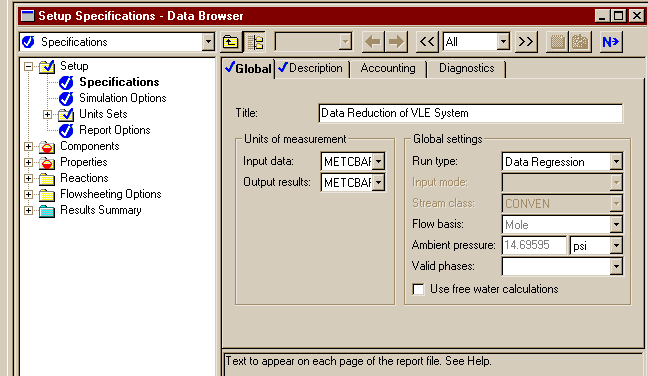
It is Complete when it comes up, but you can enter a title before punching the Next button.
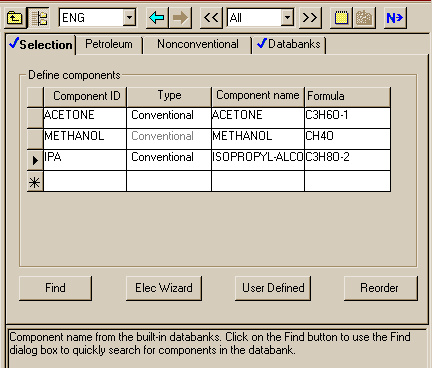
Here the compounds are filled in as in other Aspen runs and the Next button clicked so we pick the thermo package to find parameters in.
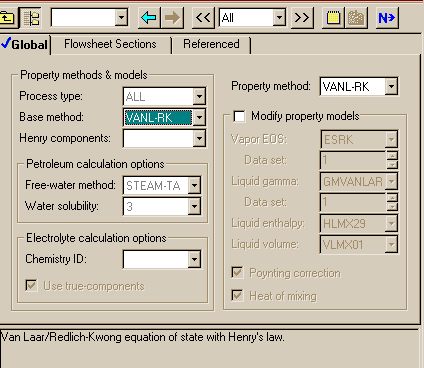
I chose to work on the Van Laar/Redlich-Kwong set and hit the Next button. Told it I would like to work on a data set and got the window:
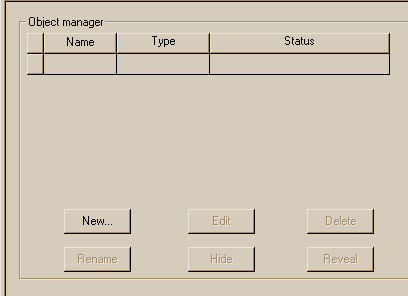
Punching the New button showed me where I could choose the ID for the data set and the type. I left the default name and picked a mixture.
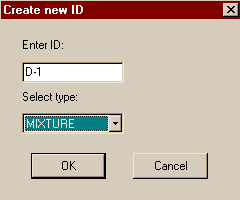
Told it to Create a data set.
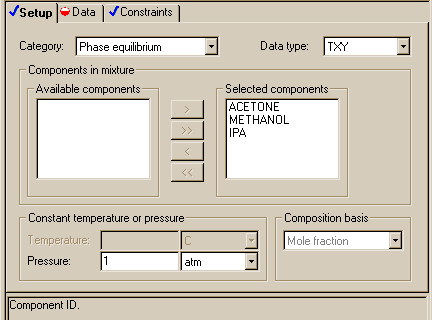
Specified the
I left the composition basis as Mole fraction. Next then brought up the place to start entering the experimantal data.

Put Data in the first column under the already filled in Std-Dev heading. You can then put in the temperatures and liquid mol fractions for each set of data. In order to put in the vapor mol fractions, you will need to enlarge the window or use the scroll bar below the table. Next leads to:
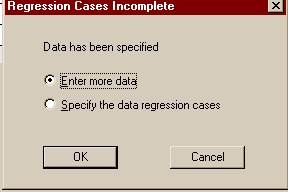
For this case we have finished entering data, but need to specify the data regression cases. OK then gives:
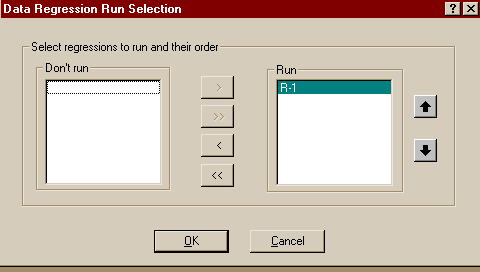
OK again leads to the execution of the regression program. The control panel shows (after waiting for the input specs to be read and understood):
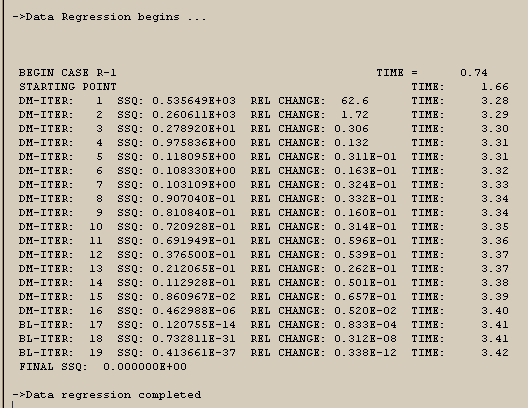
Here was one part of the Report file from the run.
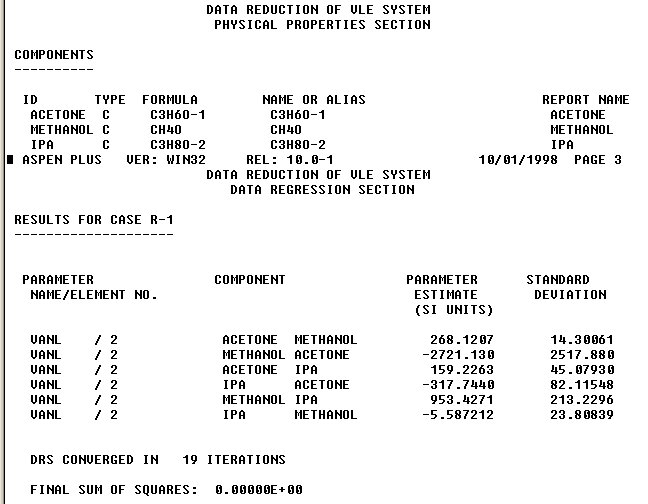
That shows the values found for the Van Laar binary coefficients. The sum of squares lists as zero, but that was the result of the small number of data points compared to the number of parameters used in the fit. Here is further parts of the report file showing a comparison of the experimental and fit data.

and

Now we will try to find what the six parameters mean and how they may be used in flash and distillation simulations. Open Propertie under the Data menu and then click to see the Binary Interaction sets. Select VANL-1 and open it for editing:
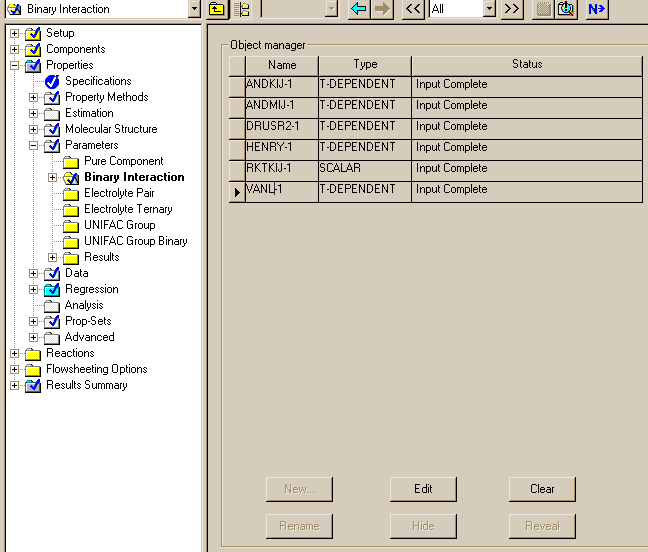
Then we can see:
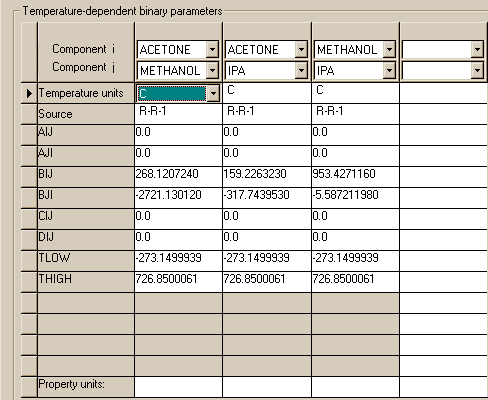
If you compare the numbers in this file with those in the Report file, you will see the six values in the Summary file are the bij parameters in the Binary.T-Dependent file. These are the numbers we need for other simulations such as in a Flash run:
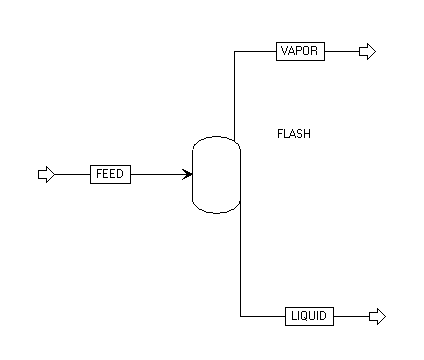
This procedure was used to make the comparison of the Van Laar equation with the experimental data in the section on evaluating various thermodynamics packages.