Results using the Discrete Cosine Transform

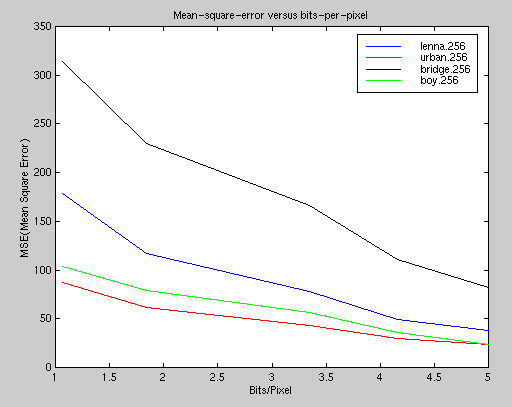
Mean-square-error versus bits-per-pixel

The graph shows how the mean square error decreases as the avarage number of bits per pixel increases (the uncompressed
images uses eight bits per pixel). The number of bits per pixel could be brought down even further (without affecting the mean
square error) by using a lossless entropy coder (such as gzip). However, the above presentation of results makes it easier to
separate the effects of the lossy image compression alone.
The mean-square-error (MSE) of an NxN image is defined as MSE=1/(N^2)*sum_over_n&m((x[m,n]-xc[m,n])^2)
where x is the original image and xc is the compressed image.
The coding of the four images (lenna, urban, bridge and boy)
was optimized to minimize the mean square error. One should keep in mind that the mean square error is not a good indicator of image perception. An image with a lower mean square error could actually look "worse" than an image with a higher mean square error.
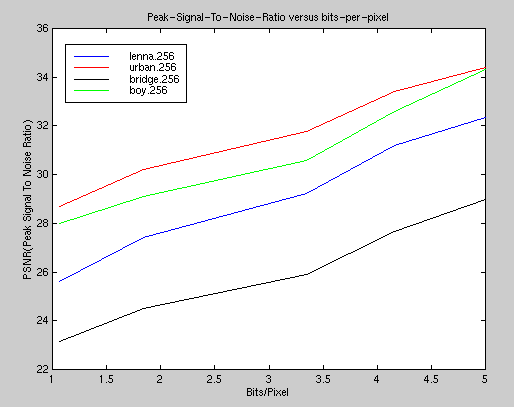
Peak-Signal-to-Noise Ratio versus bits-per-pixel

This graph shows how the peak-signal-to-noise ratio increases as the avarage number of bits per pixel increases.
The peak-signal-to-noise ratio (PSNR) of an 256x256 image is defined as PSNR = 10*log(255x255/MSE).
Back...


