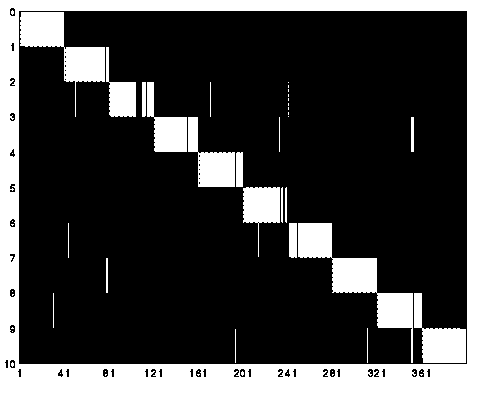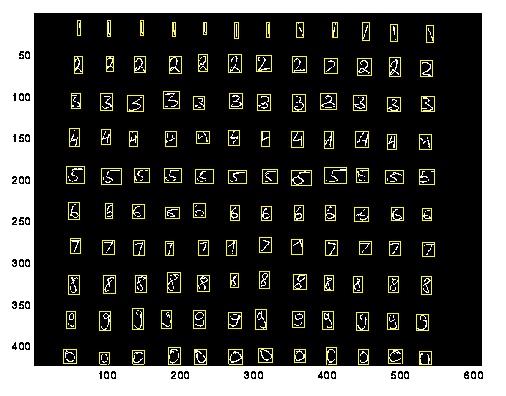

Figure 1 shows a graphical breakdown of errors. It is a graph of expected values versus determined values. A perfect system would be a diagonal of complete squares. Any white bars outside the diagonal are misrecognitions. (Note: This graph is actually a combination of Training + High Resolution tests, but in general shows the desired training.)

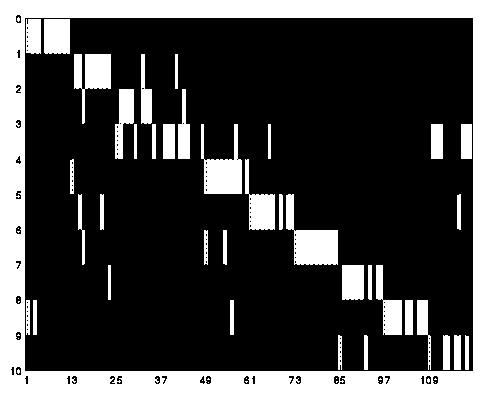
Originally we had planned for this to be our objective test sample. However, it was a full page of numbers scanned at too low a resolution. This resulted in many difficulties identifying numbers, even to the human eye. The number of misrecognized values is pretty severe, 28 of 128 or 23.33%. In one case, for nines, half were incorrectly detected.


In Figure 3, notice the numerous bands outside the diagonal.
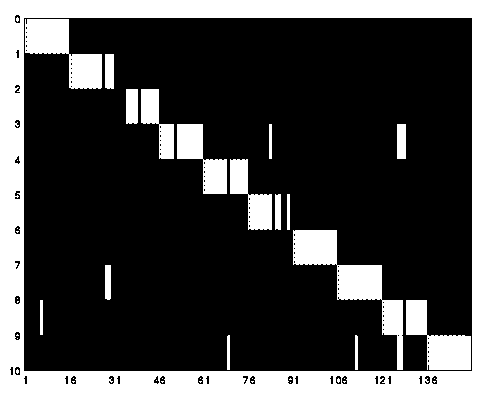
These samples were of a higher resolution, the same as the training samples. As expected, this results in much better recognition. Only 13 of 150, or 8.6%, were misrecognized. Only 2 and 5 had serious problems, resulting in 10 of the 13 errors. Both of these are very similar to other characters resulting in easy misrecognition.

As shown by Figure 2, our OCR system does much better with these higher resolution samples.
