This tutorial covers linear equations for plotting numbers onto a JPanel. It serves to jump start the sort animation homework that will be assigned later in the week..
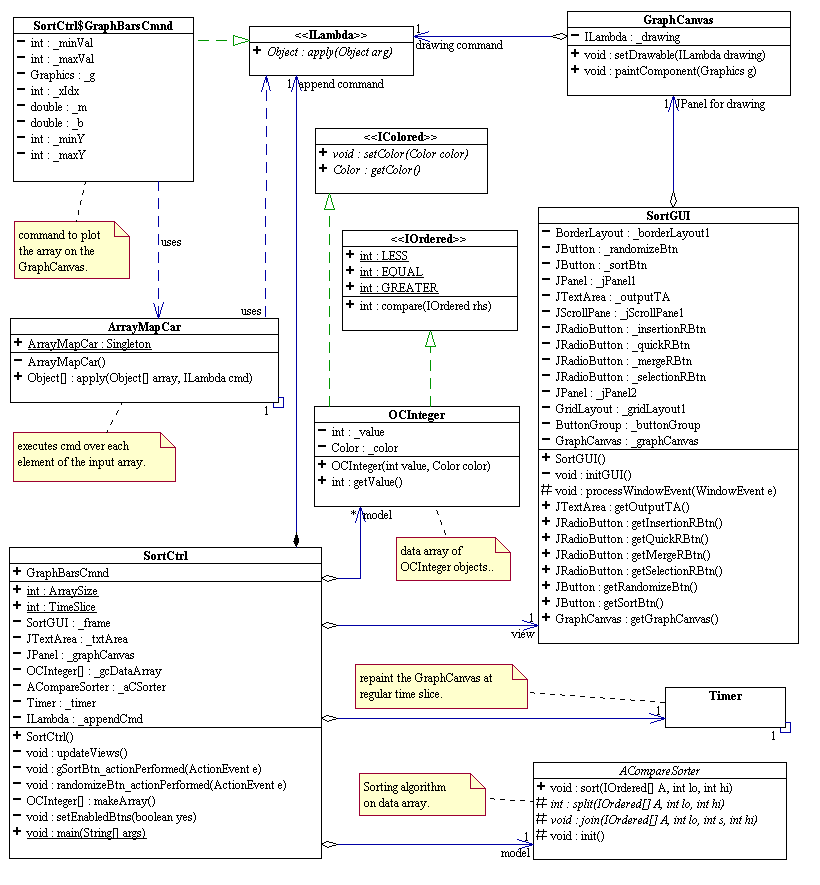
Copy the Java source code for a GUI application that animates the various sorting algorithms discussed in the lecture. To see how the application behaves, compile and run SortCtrl. Play around with this program to see how it behaves. The program is designed according to the MVC pattern as shown in the UML diagram below.
In the above diagram, the model is an array of OCInteger objects that is to be sorted according to a concrete ACompareSorter selected at runtime. SortGUI is the view. It has a GraphCanvas where the data array is plotted and animated. The design of GraphCanvas is identical to that of BodyPartsCanvas in the hangman project with the IDrawable object replaced by an ILambda object to draw on its graphics context. The ILambda object in this case is an inner object of SortCtrl, the controller: SortCtrl.GraphBarsCmnd. It makes uses of ArrayMapCar to plot each element in the data array on the GraphCanvas. It is SortCtrl.GraphCmnd that does all the plotting of the array elements. SortCtrl holds a Timer object that periodically tells the GraphCanvas to repaint. SortCtrl.GraphCmnd defines what to draw. The Timer object dictates when to draw.
NOTE: ArrayMapCar can be (and should be) implemented as an ILambda. Think about it whenever you get excited about OOP. I will ask you how to do it in the take-home final.
We want to plot an array of integers on a JPanel as rectangular bars with appropriate heights and widths. The graphics method to use here is Graphics.fillRect (int x, int y, int width, int height). It is important to first understand the orientation of the x-y coordinate system in Java graphics. As in most graphics systems, the x-coordinate of the graphics context of the JPanel extends form left to right, while the y-coordinate extends from top to bottom. The origin of the coordinate system is at the upper left corner of the bounding rectangle.
To have a "nice" plotting of a number A[i] on a JPanel, we use the simple transformation y = m * A[i] + b to map A[i] to the plane of the JPanel. Let maxVal be the maximum value in the given integer array, and let minVal be the minimum value in the given array. Plugging maxVal and minVal into the equation y = m * A[i]+ b, we get
We arbitrarily assign a value to maxY and minY, and then solve for m (the slope) and b (the y-intercept). We now use the equation y = m*A[i] +b for all element A[i] in the given array. We can think of the index i as an x-coordinate, and y = m * A[i] + b as its y-coordinate.
Exercises: