The Voltron Design Team modeled the purification section of a 1000 metric tons per day ammonia plant using Aspen and Matlab. The effluent stream from the ammonia synthesis reactor was purified to produce 1000.5 metric tons/day of 99.5 wt.% pure ammonia. The reactor was modeled based on a previous design, and a conversion of 19% per pass was used. Recycle and purge streams of 77% and 6%, respectively, were used to maximize ammonia conversion and to minimize levels of inerts in the system. Three flash drums and one centrifugal compressor were included in the scope of the design. The capital investment for the purification section of the ammonia plant, which includes these four items, was $2,128,000.
Ammonia is among the top five chemicals produced in the United States. The major use of industrially-produced ammonia is as a fertilizer, where it is most often applied as liquid directly to the soil or as ammonia nitrate. Salts of ammonia are also used as fertilizers. Ammonia is used as a refrigerant because its high heat of vaporization. Other applications of ammonia include the manufacture of explosives and the manufacture of starting materials for plastics. (1)
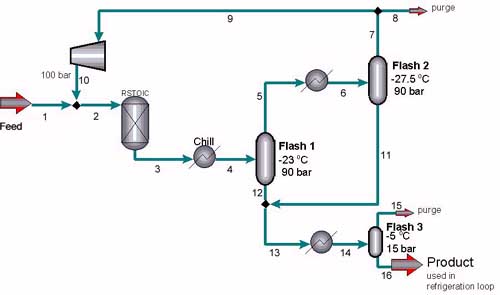
Ammonia is produced in industry from natural gas through the use of two syngas reformers and a synthesis reactor. Several steps are involved in the synthesis of ammonia; however, the scope of the Voltron design included only the purification of the product. In the Voltron design, ammonia synthesis gas is mixed with a recycle stream and fed to the reactor. The effluent is fed passed through three flash drums to obtain a high purity of ammonia. A portion of the product ammonia is used as refrigerant in the loop. A purge is required to minimize the level of inerts in the system, and hydrogen is recovered from this purge and recycled to the primary reformers in the front end of the production unit. (6)
The process of refrigeration requires the use of several heat exchangers in order to chill the reactor outlet to extremely low temperatures. The Voltron Design for the refrigeration separation process is shown in Figure 1.
Voltron has formulated a recommended design in which heat is exchanged between the reactor outlet stream and the later stages of the process stream, as well as other sources (cooling water, separate ammonia loop). However, because Voltron, Inc. does not specialize in the construction and design of heat exchangers, a simplified design is provided in which the series of heat exchangers is combined into a few ideal heaters and coolers. This simplified design is shown in Figure 2.
Three major designs for the ammonia synthesis loop are commonly used in industry; these designs vary in relative location of compression and synthesis gas addition. (6) The first possible solution is to add the synthesis gas to the loop between the reactor and the first flash and to compress the recycle stream before it enters the reactor. This model has the disadvantage that the flash includes the feed stream, and thus the ammonia is not separated at its highest concentration. The second model also involves adding the synthesis gas before the flash, but the compressor is also below the flash. This has the added disadvantages of greater compression costs and the requirement that the flash be operated at the same pressure as the inlet stream to the reactor. Both of these models are most often used when the synthesis gas is not especially purified. Because the syngas production designed by Strait, et. al. (11) produced a very pure feed stream of synthesis gas, it was not necessary to use either of these methods.
The design used by Voltron involves mixing the synthesis gas and the recycle stream to create the feed to the reactor and compressing this stream to bring it up to the desired pressure. There are two great advantages to this process in addition to the lower compression costs also found in the first design. (6) First, the flash is run when the concentration of ammonia is the highest, so the product will have a higher purity. Second, the purge can be taken after the flash, where the concentration of ammonia is the lowest and the inert concentration is highest, so less product will be lost in the purge and more inerts will be removed.
The reactor was modeled in Aspen as an rstoic reactor, using the conversion of ~19% commonly achieved in industry. The outlet temperature was set to be the temperature of the outlet stream in the reactor design by Villesca, et al (12) at 376.85āC. The composition and pressure of the feed stream entering the Voltron loop is also taken from the Villesca design.
An extremely important part of the separation design involves choosing a suitable thermodynamic package. The Voltron design employed the Redlich-Kwong Soave option set in Aspen. This package was chosen because it is recommended for gas-processing, is applicable to non-polar or mildly polar mixtures such as ours, and is useful in extreme temperature and pressure ranges. For further assurance, Dr. Paul Mathias at Aspen Tech verified that our choice of RK-Soave is a suitable one for our case. (8)
The reactor outlet is chilled to -23āC while maintaining a pressure of 100 bar. This stream then enters the first large flash drum where the pressure is lowered to 90 bar. The ammonia liquefies, and the overhead vapors are sent to another heat exchanger which chills the stream further to -27.5āC before entering the second large flash drum. This vessel separates more of the liquid ammonia product, and the overhead is purged and then recycled. This recycle stream is compressed to 100 bar and mixed into the reactor feed. The concentration of ammonia in the recycle stream is 3.8%. It is important to have a low percentage of ammonia in the recycle stream not only to maintain a higher concentration in the bottoms stream, but also because ammonia is a catalyst poison, so as little product as possible needs to be recycled to avoid damaging the catalyst.
The bottoms from both large flash tanks are combined, warmed to -5āC, and sent to the third and smallest flash vessel where the pressure is lowered to 15 bar. The remaining impurities are vaporized and purged, and the final ammonia product is collected. Based on the feed stream, the Voltron design produces 1000.5 metric tons per day of ammonia at a purity of 99.7 % (mol) or 99.5% (mass). Industries often use this product ammonia as the coolant in the refrigeration loop. Table 1 contains the flow sheet of results for all streams in the Voltron design calculated in Aspen. A summary of the stream compositions in the feed, recycle stream, reactor outlet, and product stream calculated in Aspen is included in Table 2.
|
Flowrate (met tons/day) |
Feed Stream |
Recycle Stream |
Reactor Outlet |
Final Product |
|
N2 |
1094.0 |
3299.9 |
3559.1 |
0.2 |
|
H2 |
236.5 |
717.3 |
773.6 |
0.03 |
|
Ar |
18.9 |
200.6 |
219.5 |
2.9 |
|
CH4 |
20.3 |
235.1 |
255.4 |
1.6 |
|
NH3 |
0 |
175.5 |
1190.6 |
1000.5 |
Flash Calculations in Aspen and Matlab
Aspen was used to perform all calculations of the Voltron design. The Matlab function flash.m was also used to compare with the Aspen results. The composition of the stream entering the first flash was taken from the Aspen results and entered into flash.m to perform the first Matlab flash calculation. The overhead result from this calculation was used as the input for the second Matlab flash calculation. The bottoms from the first two flash calculations were used to determine the input of the third flash calculation. The Matlab results are included in the Appendix. The product stream compositions from Matlab and from Aspen are compared in Table 3. Matlab resulted in a higher product flowrate of 1038.5 metric tons per day than Aspen's 1000.5 metric tons per day. However, the purity of the product stream in Matlab was found to be 98.2% (mole) and 97.9% (mass), as compared to Aspen's 99.7% (mole) and 99.5% (mass). The discrepancies are most likely caused by the differences in the VLE data used by the Matlab functions and by Aspen's RK-Soave option set.
|
FINAL PRODUCT (mass fractions) |
ASPEN |
MATLAB |
|
N2 |
2.73E-04 |
1.32E-02 |
|
H2 |
3.13E-05 |
4.06E-04 |
|
Ar |
2.87E-03 |
1.09E-03 |
|
CH4 |
1.55E-03 |
6.10E-03 |
|
NH3 |
0.995 |
0.979 |
The bubble points and dew points of the process stream were calculated in both Aspen and Matlab in order to set the temperature limits for each flash drum. For each flash drum in Aspen, the bubble and dew points were calculated by setting the vapor fraction of the vessel to 0 and 1, respectively. The resulting outlet temperature was then assumed to be the bubble or dew point. The Matlab functions bubpt.m and dewpt.m were used along with the property data set given with the file startup in the FORTRAN program start301a. The values calculated in Matlab correlate relatively well with those calculated in Aspen. The flash temperatures used in the Voltron design fall within the limits set by the calculated bubble and dew points. The bubble points and dew points of the process streams entering each flash drum calculated in Aspen and Matlab are included in Table 4.
|
VESSEL |
BUBBLE POINT, āC |
DEW POINT, āC |
VOLTRON FLASH TEMP, āC |
|
|
ASPEN / MATLAB |
ASPEN / MATLAB |
|
|
Flash 1 |
-231.5 / -209.3 |
18.2 / 28.4 |
-23 |
|
Flash 2 |
-232.3 / -211.7 |
-23 / -23 |
-27.5 |
|
Flash 3 |
-175.8 / -183 |
38.3 / 34.5 |
-5 |
Since the volumetric vapor flows through the first two flashes (Table 1) were much greater than the volumetric liquid flows, the vessels were sized based on vapor flow using Stoke's Law. (7) A sample calculation is included in the Appendix. The maximum vapor velocity was calculated from the densities of the two phases. This velocity was then used to calculate the minimum cross sectional area of the vessel. This was used to get the diameter of the vessel. The article by Monnery and Svrcek gives an L/D ratio of 4.0 to 6.0 for vessels operating at more than 500 psig, so an L/D ratio of 6.0 was chosen for these vessels. (9)
The sizing for the letdown, or Flash 3, was performed differently. In this vessel, the liquid volumetric flowrate was about 5 times that of the vapor volumetric flowrate. Therefore the sizing technique was the one described in the textbook by Biegler , Grossman, and Westerberg. (3) This sizing technique takes into account the liquid flowrate with a holdup time of 5 minutes. The size for each vessel is listed below.
|
VESSEL |
T/T LENGTH (FT.) |
DIAMETER (FT.) |
|
Flash 1 |
45 |
7.5 |
|
Flash 2 |
45 |
7.4 |
|
Flash 3 |
26 |
4.3 |
For costing purposes, compression cost was also considered. The ammonia synthesis loop is operated at a very high pressure and compression costs are the most substantial costs of the loop. Though flashes at lower pressures required less expensive, thinner walled vessels, the tradeoff with compression cost was too much, and higher pressure flashes were chosen. The choice of higher pressure flashes reduces installed costs by requiring a smaller compressor, and operating costs by reducing the horsepower of the compressor.
A centrifugal compressor was chosen for several reasons. First, the large flowrates involved in the ammonia synthesis and purification process would require many more compression stages if reciprocating compressors were used. The centrifugal compressor can handle the high flowrates more easily than other compressor models. Additionally, although a centrifugal compressor may be more expensive to install initially, these compressors are more dependable and provide consistent service. (5)
Different operating pressures and temperatures were tried to determine the minimum cost while maintaining purity. The resulting costs are shown in Table 6.
|
P1 |
T1 |
P2 |
T2 |
P3 |
T3 |
mton/day |
Purity |
C1 |
C2 |
C3 |
CComp |
Ctotal |
|
(bar) |
(āC) |
(bar) |
(āC) |
(bar) |
(āC) |
|
$ |
$ |
$ |
$ |
$ |
$ |
|
85 |
-34.4 |
85 |
-37.2 |
17.2 |
-5 |
1006 |
0.997 |
291.5 |
290.6 |
16.3 |
1664.3 |
2242.7 |
|
75 |
-34.4 |
75 |
-37.2 |
17.2 |
-5 |
1005.34 |
0.997 |
237.2 |
236.5 |
16.3 |
1803.7 |
2293.7 |
|
95 |
-34.4 |
95 |
-37.2 |
17.2 |
-5 |
1006.49 |
0.996 |
320.3 |
319.4 |
16.3 |
1521.2 |
2177.2 |
|
95 |
-34.4 |
85 |
-37.2 |
17.2 |
-5 |
1005.86 |
0.996 |
320.3 |
290.6 |
16.3 |
1664.3 |
2291.5 |
|
85 |
-30 |
85 |
-35 |
17.2 |
-5 |
1004.8 |
0.997 |
291.5 |
290.6 |
16.3 |
1665.6 |
2264 |
|
85 |
-25 |
85 |
-30 |
17.2 |
-5 |
1001.88 |
0.997 |
291.5 |
290.6 |
16.3 |
1668.5 |
2267.9 |
|
90 |
-25 |
90 |
-30 |
15 |
-5 |
1002.1 |
0.997 |
305.9 |
305 |
16.3 |
1559.7 |
2186.9 |
The optimum pressure and temperatures for cost purposes are shown in Table 7.
|
VESSEL |
PRESSURE (BAR) |
TEMPERATURE (āC) |
|
Flash 1 |
90 |
-23 |
|
Flash 2 |
90 |
-27.5 |
|
Letdown |
15 |
-5 |
The overall installed costs for the vessels and compressor are summarized below.
|
UNIT |
SPECIFICATION |
COST |
|
Recycle Compressor |
HP = 2500 |
$1,498,200 |
|
Flash 1 |
L = 45 ft, D = 7.5 ft |
$307,500 |
|
Flash 2 |
L = 45 ft, D = 7.4 ft |
$306,000 |
|
Letdown |
L = 26 ft, D = 4.3 ft |
$16,300 |
|
TOTAL COST |
|
$2,128,000 |
Heat exchange and hydrogen recovery are two areas that Voltron does not specialize in. However, to aid in minimizing production costs and maximizing returns on the process, the following recommendations are offered.
The greatest amount of heat created in the process is in the ammonia synthesis reactor. The heat of reaction in this synthesis is 46.22 kJ/mol, or 649 kcal/kg. This heat can be used to produce high-pressure steam, eliminating the cost of purchasing this steam from elsewhere. (6) Since the steam, used in the reforming section of the synthesis gas production, is at such high pressure, this is a significant savings brought about by the utilization of the heat of reaction.
Another cost-saving use of heat exchange is to use a portion of the product ammonia as a refrigerant in the synthesis loop. This is outlined in Figure 1 but was not included as part of Voltron's package. For heat exchange consulting, the partnerships of Li-Liu-Narasimhan and Fleet-Fontenot-Kim are recommended.
Finally, Voltron recommends the recovery of hydrogen from the purge stream to be used in the primary reformer of the synthesis gas production unit. In the cryogenic hydrogen recovery process, the purge gas is chilled and separated in a high-pressure separator. The vapor is put through a small compressor and returned directly to the primary reformer inlet. The liquid, containing mostly inerts and some dissolved hydrogen, is separated in a low-pressure separator. The vapor from this separator is fed to the synthesis gas compressor and used with the syngas feed. This reuse of the purge gas represents a significant cost savings for the ammonia synthesis plant, as more than 97% of the hydrogen that would normally be lost to fuel is now recycled and used in the process. (4)
The goal of a 1000 metric ton per day production rate of ammonia was met and exceeded, with a product of 1000.5 tons/day and a purity of 99.5 mass (99.7 mol) percent ammonia. The ammonia synthesis loop was modeled with rstoic using the Villesca reactor with a recycle stream The purification process was realistically modeled with the RK-Soave thermodynamic package in Aspen using three flash units. The purification was also modeled in Matlab using the flash.m function, and the results were comparable to Aspen.
The models created in Aspen and Matlab demonstrate the refrigeration section of an ammonia synthesis plant. The process was optimized with respect to design, and purity, and economics based on flash and compressor temperature, pressure, and location within the synthesis loop. Further economic optimization would result from more detailed heat exchange within the system and the recovery of hydrogen from the purge gas.
1. "Ammonia." Encyclopedia Brittanica Online, 1997. http://www.eb.com.
2. Banks, Roy. "Hydrogen Recovery Unit Ups NH3-plant Efficiency." Chemical Engineering. October 10, 1977, pp. 90-92.
3. Bigler, Lorenz T., Ignatio E. Grossmann, and Arthur W. Westerberg. Systematic Methods of Chemical Process Design. New Jersey: Prentice Hall, 1997, p.112
4. Combs, C.A. "Improving Efficiency in an 1150 ton/d Ammonia Plant." Ammonia Plant Safety. Vol. 23, pp. 32-37. (1981)
5. "Compressors and Expanders." Gas Processors Suppliers Association: Engineering Data Book. 10th Edition, 1987, Vol. 1, Section 13.
6. Dybkjaer, I. "Ammonia Production Processes." Ammonia: Catalysis and Manufacture, ed. by A. Nielsen. New York: Springer Verlag, 1995, pp. 221-327.
7. Liu, Y.N. Personal Communication. Air Products and Chemicals, Inc. Trexlertown, PA. October 1997.
8. Mathias, Paul. Personal Communication. Aspen Tech. October 1997.
9. Monnery, Wayne D and William Y. Svrcek. "Successfully Specify Three-Phase Separators." Chemical Engineering Progress. September 1994, p. 35.
10. Phillippe, Angie G. Personal Communication. Haldor Topsoe, Inc. Houston, TX. \October 1997.
11. Strait, Megan, Glenda Allum, and Nisha Gidwani. Synthesis Gas Reformers. Ceng 403 Project 1 Report, October 1997.
12. Villesca, Josue, Vidya Bala, and Alejandra Garcia. Reactor Project: Ammonia Synthesis. Ceng 403 Project 1 Report, October 1997.
Matlab was used to perform the flash calculations for comparison with the Aspen results. In addition, the bubble points and dew points for each of the flash streams were also calculated in Matlab. Functions used were flash.m, bubpt.m, and dewpt.m, which can be used upon entering the necessary information into the FORTRAN program start301a to load the property data, and loading this data in Matlab using start301b. The calculations are included below.
A sample calculation for vessel sizing is also included.
>> start301b
Copyright 1996 Rice University
All rights reserved
If you have not run the FORTRAN program start301a to
produce a data file, do so now or you can just set
the names without any data. A blank reply for
the file name will let you just set the names.
Give the name of your data file:flash1
How many streams will there be?1
Here are your compounds' formulae and names:
No. Formula Name
1 N2 nitrogen
2 H2 hydrogen
3 Ar argon
4 CH4 methane
5 NH3 ammonia
Here are your reactions:
1 N2 + 3 H2 --> 2 NH3
>> %flash 1
>> t = -23;
>> T=t+273.15;
>> p=90;
>> P=p*100;
>> mf = [.2109979 .6373330 9.12479e-3 .0264413 .1161029];
>> flash(T,P,mf)
Temperature= 250.15K Pressure= 9000.00 kPa V/F=0.8864
Compound Feed Liquid Vapor K=y/x
nitrogen 0.21100 0.04327 0.23248 5.37281
hydrogen 0.63733 0.04428 0.71331 16.10866 FLASH 1
argon 0.00912 0.00221 0.01001 4.53590
methane 0.02644 0.01602 0.02778 1.73395
ammonia 0.11610 0.89422 0.01642 0.01837
>>
>> %Flash 2 based on output from flash 1 in matlab
>>
>> t=-27.5;
>> T=t+273.15;
>> mf = [0.23248 0.71331 0.01001 0.02778 0.01642];
>> flash(T,P,mf)
Temperature= 245.65K Pressure= 9000.00 kPa V/F=0.9964
Compound Feed Liquid Vapor K=y/x
nitrogen 0.23248 0.04559 0.23316 5.11419
hydrogen 0.71331 0.04515 0.71574 15.85367 FLASH 2
argon 0.01001 0.00235 0.01004 4.27243
methane 0.02778 0.01726 0.02782 1.61176
ammonia 0.01642 0.88965 0.01325 0.01489
>>
>> flow1=25088.68; % mole flow into first flash, Kmol/hr
>> flow2=0.8864*flow1; %vapor flow from flash 1
>> liq1=flow1-flow2; % liquid bottoms of flash 1
>> flow2vap=0.9964*flow2; % overhead flow from flash 2
>> liq2 = flow2-flow2vap % bottoms of flash 2
liq2 =
80.0590
>> mol1=[0.04327 0.04428 0.00221 0.01602 0.89422]*liq1;
>> mol2=[0.04559 0.04515 0.00235 0.01726 0.88965]*liq2;
>> mf3 = (mol1+mol2)./(liq1+liq2); %mole fraction of inlet to flash 3
>> %third flash...
>> t=-5;
>> T=t+273.15;
>> p=15;
>> P=p*100;
>> flash(T,P,mf3)
Temperature= 268.15K Pressure= 1500.00 kPa V/F=0.1166
Compound Feed Liquid Vapor K=y/x
nitrogen 0.04333 0.00805 0.31068 38.61736
hydrogen 0.04430 0.00345 0.35380 102.48755 FLASH 3
argon 0.00221 0.00046 0.01552 33.89384
methane 0.01605 0.00650 0.08841 13.59339
ammonia 0.89410 0.98154 0.23160 0.23596
>> purge3=0.1166*(liq1+liq2)
purge3 =
341.6535
>> liq3 = liq1+liq2-purge3 % product stream flow rate
liq3 =
2.5885e+03
>> product=[0.00805 0.00345 0.00046 0.00650 0.98154].*liq3
product =
1.0e+03 *
0.0208 0.0089 0.0012 0.0168 2.5407 PRODUCT STREAM FLOWS
>> % kmol/hr
>>
>> [t,ys] = bubpt(9000,[.2109979 .637333 9.12479e-3 .0264413 .1161029])
t =
63.8703 BUBBLE PT (āK), FLASH 1
ys =
0.0003 0.9997 0.0000 0.0000 0.0000
>> %for flash1
>> %flash 2
>> [t,ys] = bubpt(9000,[0.23248 .71331 .01001 .02778 .01642])
t =
61.4473 BUBBLE PT (āK), FLASH 2
ys =
0.0002 0.9998 0.0000 0.0000 0.0000
>> [t,ys] = bubpt(1500,mf3)
t =
90.1485 BUBBLE PT (āK), FLASH 3
ys =
0.0106 0.9891 0.0002 0.0001 0.0000
>> % flash 1
>> [t,ys] = dewpt(9000,[.2109979 .637333 9.12479e-3 .0264413 .1161029])
t =
301.5546 DEW PT (āK), FLASH 1
ys =
0.0248 0.0341 0.0012 0.0077 0.9323
>> %flash2
>> [t,ys] = dewpt(9000,[0.23248 .71331 .01001 .02778 .01642])
t =
250.1387 DEW PT (āK), FLASH 2
ys =
0.0433 0.0443 0.0022 0.0160 0.8945
>> %flash3
>> [t,ys] = dewpt(1500,mf3)
t =
307.6794 DEW PT (āK), FLASH 3
ys =
0.0008 0.0004 0.0000 0.0007 0.9975
>> diary off
Sample Calculation for Vessel Diameter Sizing using Stokes Law
Dr = rl- rv
rl = 41.644 ft3/hr
rv = 2.374 ft3/hr
kv = 0.3 (typical in industry)
Vmax=0.3*[(41.644-2.374)/2.374]^.5 = 1.22 ft/s
Fv = 194694 ft3/hr (flow of vapor)
Cross Sectional Area = Fv/Vmax = 194694/3600/1.22 = 44.33 ft2
Diameter = (44.33(4)/pi)^.5 = 7.5 ft