Separation of Heptenes

Separations Project Preliminary Report


Group Leader

Ankur Goel

Partners

Ariel Flores

Andrew Philips

Separation of Heptenes


Contents

Abstract *

Introduction *

Thermodynamic Considerations *

Simulating Vapor-Liquid Equilibrium Using the Correct Property Package *

Validity of the Peng-Robinson EOS *

The Effectiveness of the Required Separations *

Column Optimizations *

Base Case Process Description *

Respecifying the PFD *

Column Configurations *

Optimization Methodology *

The Optimal Column Configuration *

Optimized Column Design Specifications *

Optimized Heat Exchanger Design Specifications *

Optimized Pump Design Specifications *

Reflux Vessels *

Cost Analysis *

Methodology *

Economic Optimization of the Cases *

Calculated Cost *

Capital Costs *

Utility Cost *

References *

Appendix A – Stream Tables *

Product Streams *

Utility Streams *

Appendix B – Cost Methodology *

Capital Costs *

Utility Costs *

Appendix C – Column Configurations *


Abstract

In this study, a process for separating heptenes from other hydrocarbons was designed, simulated, optimized, and costed. The given product specification calls for a 99% pure 1-heptene stream. The presented base case carries a capital cost of $1,230,600 with an associated ten year utility cost of $1,141,700, present value. It was found that this base case had a design error, and that an extra column would need to be added for an equivalent separation. These four columns led to 14 different column configurations, each of which was simulated and optimized. The top five cost efficient configurations were further evaluated via full Hysys simulations. Through a more thorough optimization process, a the most cost-effective configuration was found to be similar to the base case: the first column is a C4-C6 split. The distillate is sent to another column, where a C3-C4 split occurs. The bottoms to the first column is to sent to another column, where the C6-C7 split results. The bottoms are then sent to a final column for a C7-C8 split. This configuration carries a capital cost $1,040,700 with a ten year utility cost of $1,425,200.

The Peng-Robinson equation of state property package was selected for our process, since it rigorously calculates the properties of cold hydrocarbons. The hydrocarbons subject in this separation process are relatively similar in size and chemical properties. Nonetheless, the enthalpies of mixing were determined for the interacting molecules and proved to small enough to support not using an activity model.

Introduction

The purpose of this project was to simulate the separation process that occurs during the production of 1-heptene and other unsaturated products from an initial mixture of C3 and C4 hydrocarbons. 1-heptene is the main product desired from this process since it has several applications including usage as a high-octane blending agent for gasoline and it aids in the production of plasticizers. The initial basis for our project was the process covered in the Turton text5 on pp. 736-746. The book describes the portion of the process that we analyzed as follows.

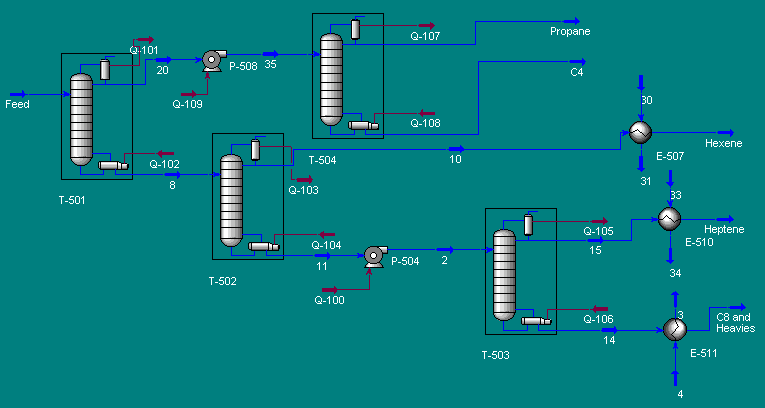
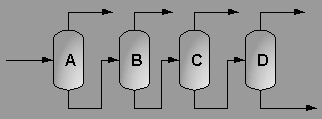
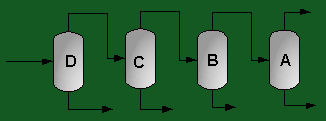
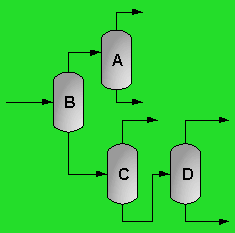
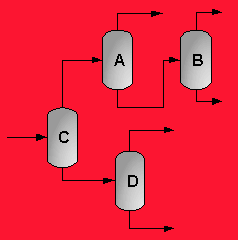
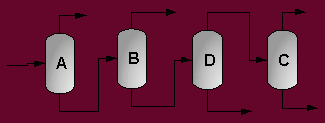
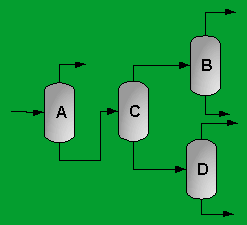
A partially vaporized reactor effluent is sent to the first of three columns. In the first column, the unreacted C3 and C4 hydrocarbons are separated from the rest of the materials. The C3 is then used as fuel gas while the C4 is sent to a LPG storage tank. The second column separates the 1-hexene from the remaining materials and sends it off as a product. Finally, the third column separates the desired 1-heptene product from the undesired C8 and heavier compounds. The C8 and heavier compounds are eventually processed off-site in order to remove the heavy materials and to hopefully recover some catalyst. The PFD given by Turton, et al. for the separation portion of the process is given below5.

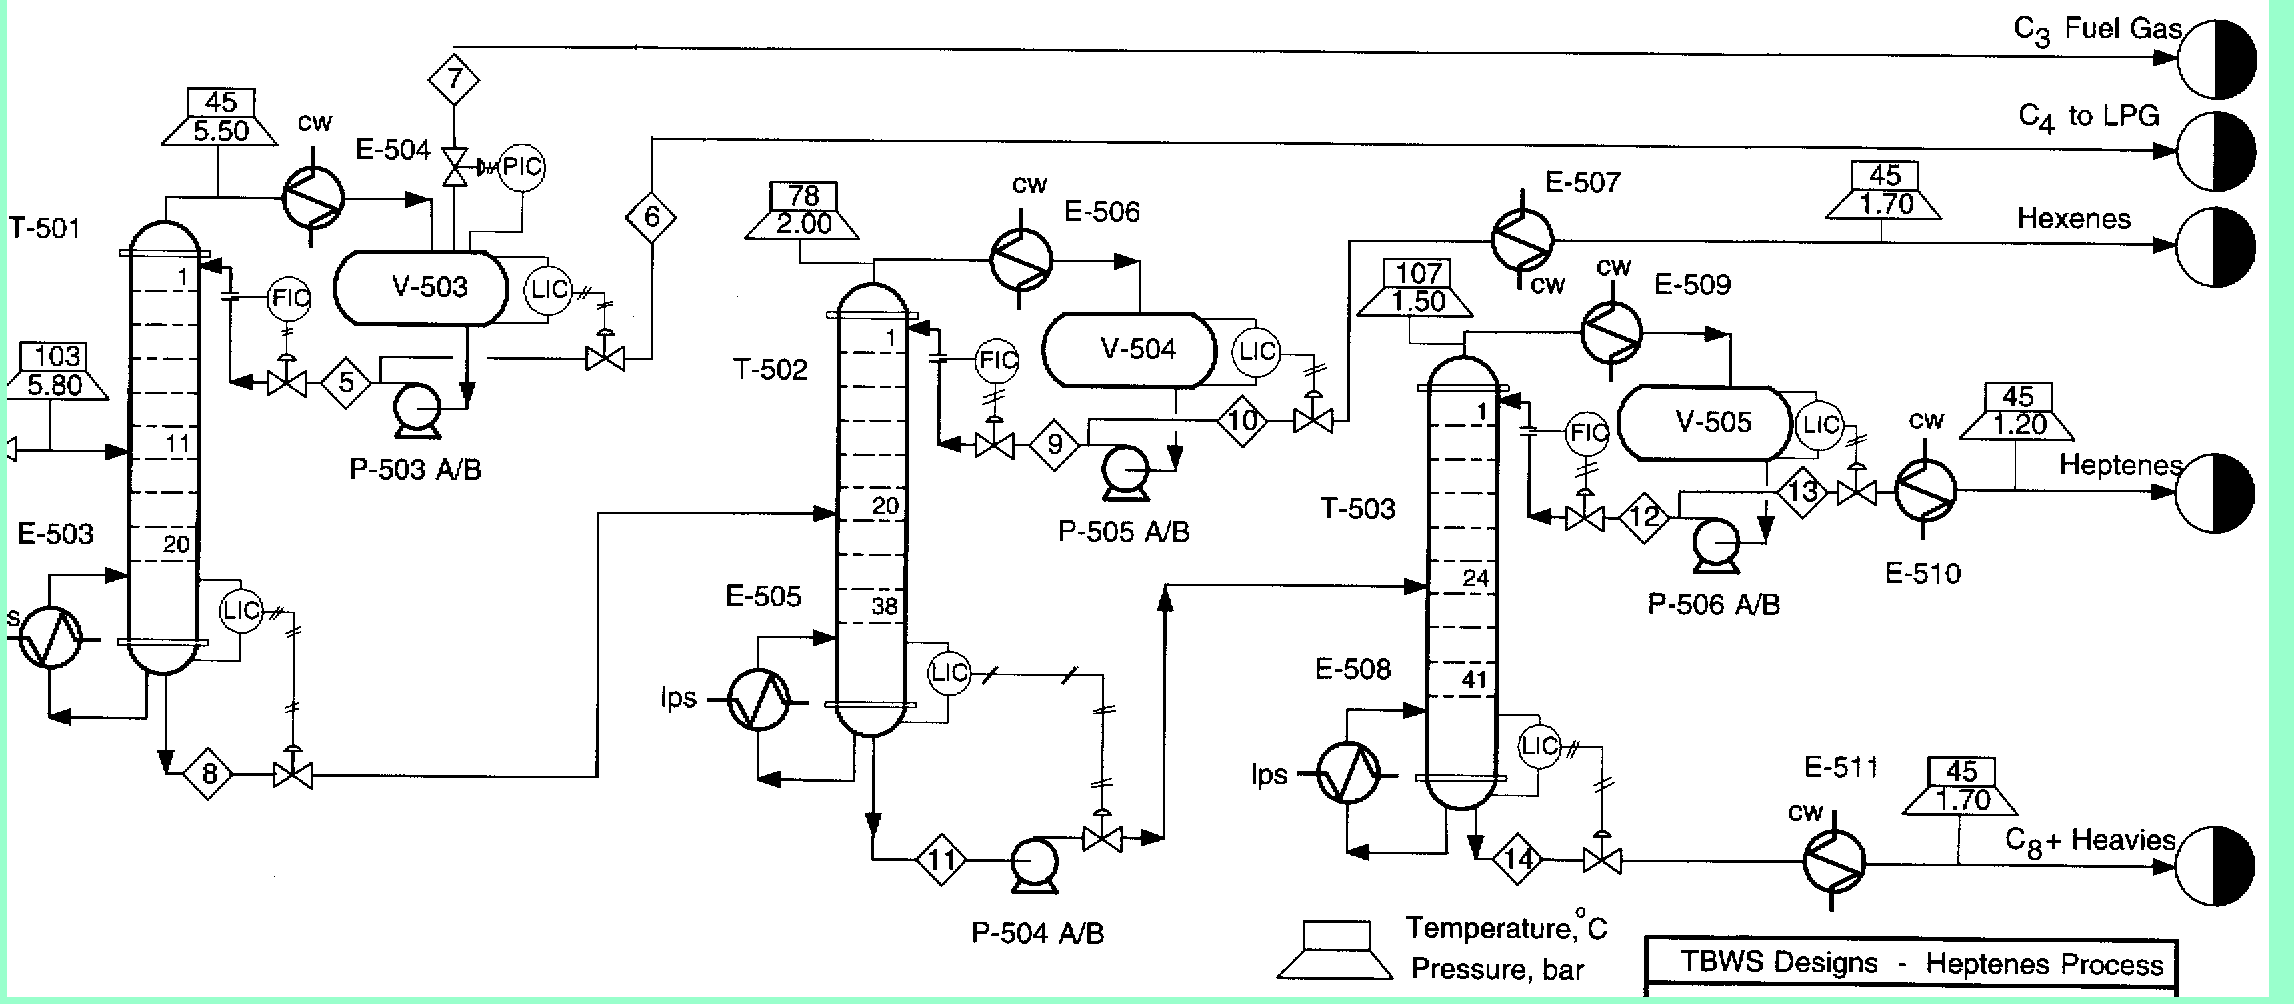
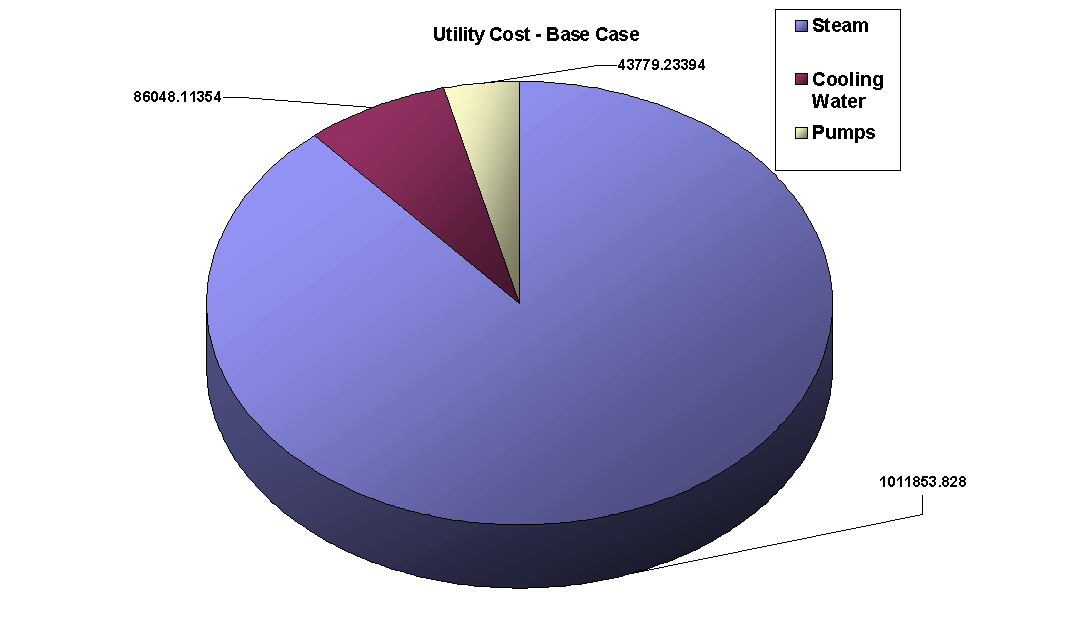
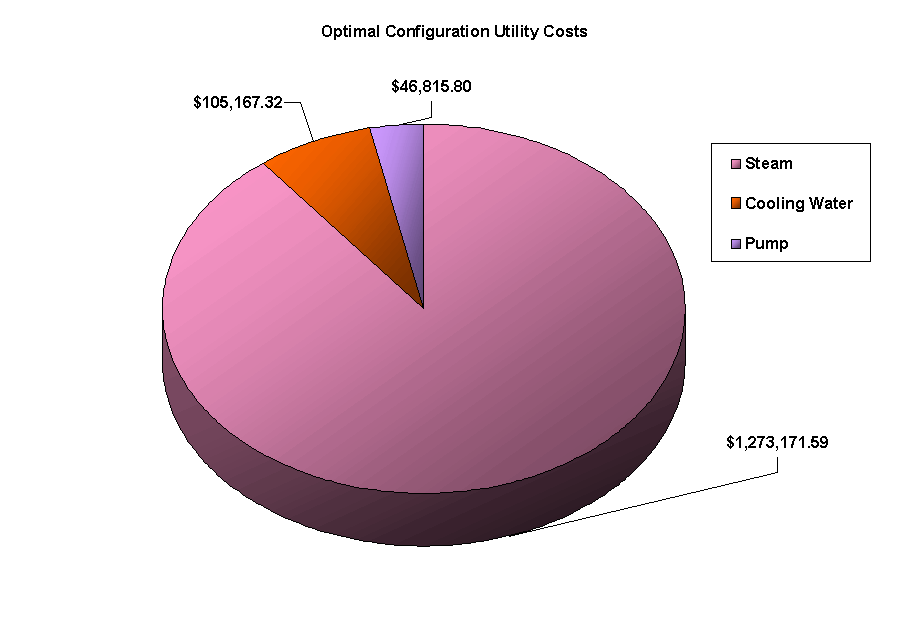
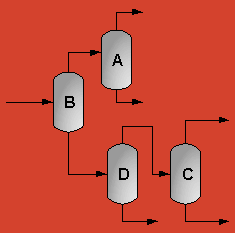
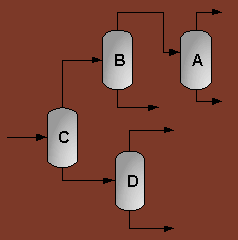
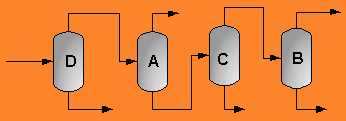
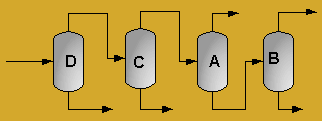
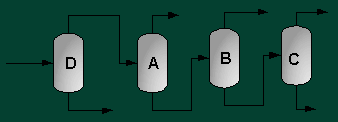
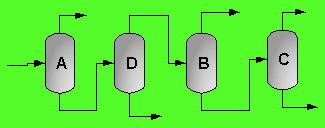
The above PFD is a preliminary estimate of the actual separation that occurs in the production of 1-heptene. It is then our job to improve this model by reducing cost and increasing profit without sacrificing the purity or output of the desired products. The rest of the report is dedicated to describing the methods we used to optimize the above process and to provide the corresponding results.

Design specifications that may not be altered due to feed stock supply and downstream equipment demand were agreed to as follows:

    1. The 1-Heptene stream should be 99% pure on a molar basis.
    2. No more than 0.2 kmole/hr of 1-Hexene may leave in the distillate of the first column.
    3. The 1-Hexene product stream should be 93% pure on a molar basis.
    4. The C3 fuel gas stream can contain moderate amounts of C4 impurity.

Thermodynamic Considerations

Simulating Vapor-Liquid Equilibrium Using the Correct Property Package

The hydrocarbon compounds being considered can all be described as well-behaved. Furthermore, there are no azeotropes present in the separation of any of the components. Nonetheless, an effort to obtain activity coefficient or binary data on the components was made. However, such information with regards to our components was not available. Data concerning the interactions of our components with different solvents was found, but no significant correlation with this data was possible for our situation.

Consequently, proof that an equation of state property package was indeed suitable for our operation was sought out. Activity coefficients and activity models try to accurately depict the deviations of pure liquid characteristics upon mixing. In particular, the Wilson equation takes into account the situation in which components exhibit a difference in intermolecular forces as well as molecular size. Such characteristics lend to non-zero enthalpies of mixing1.

Our components are very similar in size and structure and can be considered relatively non-polar. However, dispersion forces between the molecules are still evident. In order to quantify the possible effect of these forces, non-polar cohesion parameters were used. These non-polar cohesion parameters were used to evaluate the interchange cohesion pressures, which in turn lead to the energies of mixing. For non-polar mixtures, the cohesion pressure can be expressed as:

Aij = (d i - d j)2

Where d is expressed in Mpa1/2.

Since we are dealing with non-polar substance, the energy of mixing as a function of the cohesion pressure is the only contributor to the activity coefficient. The expression for the activity coefficient of an infinite dilute solution for a binary system is:

Lnj f¥ (x) = (jV/RT)*[( d i - d j)2]

Cohesion pressure at corresponding molar volumes is presented in Table 1. Information was found for most of our components1.

Liquid

Temp (C)

Vol (cm3/mol)

d (Mpa1/2)

Propane 25 85 12.7
Propylene 25 79 12.5
i-Butane 25 105.5 12.8
n-Butane 25 101.4 13.5
i-Butene 25 95.4 13.7
1-Butene 25 95.3 13.7
Hexene 25 125.9 15.1
Heptene 45 145.5 14.8

Therefore, when the contributions are considered for all of the possible interactions, the results in Table 3 are obtained.


Propane

Propylene

i-Butane

n-Butane

i-Butene

1-Butene

Hexene

Heptene

Propane

- 0.1389 0.0347 2.2224 3.4725 3.4725 20.0015 15.3137

Propylene

0.1291 0 0.2905 3.2274 4.6474 4.6474 21.8170 17.0728

i-Butane

0.0431 0.3879 0 2.119 3.4911 3.4911 22.7998 17.2399

n-Butane

2.6512 4.1425 2.0298 0 0.1657 0.1657 10.6047 7.0008

i-Butene

3.8974 5.6122 3.1569 0.1559 0 0 7.6388 4.7158

1-Butene

3.8933 5.6063 3.1536 0.1557 0 0 7.6308 4.7109

Hexene

29.6258 34.7692 27.2084 13.1670 10.081 10.081 0 0.4629

Heptene

26.2134 31.442 23.7763 10.0455 7.1923 7.1923 0.5350 0

Within our considered components, some of the interactions could conceivably provide enough of a contribution to consider activity coefficients in our simulation. The calculated results support the fact that as the size differential of the interacting molecules increases, their activity contributions also increase significantly. Furthermore, when considering non-polar interactions, another term is added to the contribution, making it considerably larger.

However, when considering the components that split at each separator, the interactions are rather negligible. For example, within the C4 and C3 splitter, the pertinent interactions would be those of propane, butanes and butenes. From the tables, it is clear that the interactions of these components are rather small and therefore negligible.

Consequently, when considering the main components split at each separator, one finds that their interactive energy contributions are relatively low. Unfortunately, cohesion pressure information was not available for some of the larger hydrocarbons. However, it would probably be the case that due to their very similar structure, their contributions would also be negligible. Due to such small contributions, it is a goods decision to use an equation of state property package for separator simulating for this case.

Validity of the Peng-Robinson EOS

Hypotech highly recommends the use of the Peng-Robinson EOS property package for oil, natural gas and petrochemical applications6. The hydrocarbon characteristics of our process are very similar to these situations. In general, these systems deal with non-ideal compounds that exhibit little deviation from their pure characteristics.

Furthermore, Hyprotech has put forth a large amount of effort in enhancing this property package for HYSYS. The Peng-Robinson EOS has been improved to yield accurate phase equilibrium for very large temperature and pressure ranges. Such ranges far surpass any of the other equation of state that HYSYS offers. Other property packages lose some of their accuracy due to their additional efforts towards simulating non-ideal scenarios. However, since such considerations do not have to be taken into account, the Peng-Robinson EOS proves to be the more plausible property package6.

The Effectiveness of the Required Separations

When a mixture of two components in the liquid and vapor phase come into contact, the components will diffuse until the two-phase compositions reach equilibrium. The mole fractions x and y express these liquid and phase compositions respectfully3. The equilibrium curves lie above the reference diagonal and consequently, a plot of the mole fractions of the more volatile species is expressed by each of the following graphs, Figure 1 through Figure 4. The axis labels identify the more volatile component. All of the following figures depict a binary plot for the light and heavy key components for each of the four major splits found in the process. The components exhibiting the highest and lowest volatilities are used as the subjects for the plots.

All of the figures depict favorable separating conditions for the components involved. There are no azeotropes present and the relative volatilities of the system provide for a clean and simple separation.

Figure 1 exhibits the vapor-liquid interactions between propane and i-butane. The number of trays could easily be determined from the graph if these were indeed the only two components present.

Figure 2 also exhibits a clean separation between 1-butene and 1-hexene. However, it is apparent that 1-butene is considerably more volatile than 1-hexene. This will provide for a smaller tray requirement since the separation process will occur more readily.

Figure 3 expresses the binary interactions between 1-Heptene and 1-Hexene. The relative volatility of hexene with respect to heptene is not too large. Consequently, the binary curve is closer to the reference line and any desired separations would require a larger quantity of trays.

Similar interactions are depicted in Figure 4 for heptene and octene. The slimmer area between the binary plot and the reference line will provide for a larger number of theoretical plates.

Column Optimizations

Base Case Process Description

Turton, et al describes the base case process for the separation of 1-Heptene from other hydrocarbons5. In it, a reactor effluent is fed to a series of three distillation columns. The first column, T-501, will separate the C4 components from the C6 and heavier components. This column uses a partial condenser, sending a pure propane stream off as vapor distillate and the C4 compounds (1-butane, isobutane, 1-butene, and isobutene) off as liquid distillate. The propane stream is then used as fuel gas. The C4 stream is recovered and sent to an LPG tank for later sale. The bottoms from T-501 are then sent to a second column, T-502. T-502 separates 1-hexene and some C4 impurity from 1-heptene and heavier components. The 1-hexene recovered has a modest 93% purity. The bottoms from T-502 are then sent to the final column T-503, the largest column of the set, which operates at near atmospheric pressure and higher temperatures. Due to the size of this column, the feed must be pumped up from T-502 in order to reach the feed stage. The 1-Heptene distillate stream will contain 99% pure heptene. The bottoms of T-503 will contain almost all of the octene and undecene specified in the problem, as well as a small but significant amount of 1-Heptene. Both the Heptene and Octene product streams are then cooled to a final temperature of 45° C using simple double pipe heat exchangers running cooling water.

The condenser of each column is a fixed shell and tube heat exchanger, running cooling water between 30-40° C. A small reflux drum helps to control flow along the column, and a pump is used to send the flow back to the top stage above stage pressure. The reboiler of each column is a floating head heat exchanger running low pressure steam at 160° C.

Respecifying the PFD

Upon closer inspection of the base case PFD, it is readily apparent that several mistakes were made in its design. The most glaring error is found in the partial condenser on the first column, T-501. This condenser separates propane from butane, creating an almost pure propane stream for the fuel gas. However, propane simply does not separate itself from butanes that easily. Table 3 presents solutions to rectify this problem.

Solution

Pros

Cons

Simply combine the propane and butane streams and use a total condenser Significantly simplifies simulation of the flowsheet Creates impure LPG. Loss of fuel gas means that the plant will have further utility costs. Total condenser will have higher utility cost.
Allow the propane stream to contain significant amounts of butane impurity Stays within the PFD given in the base case. The cheapest option. Some butanes that could have used for LPG are lost to fuel gas. The VLE envelope for the partial condenser occurs over a 1.5° C temperature range, making it difficult to get large amounts of propane without large amounts of butane.
Add a fourth fractionater to separate the propane and butane Allows the parameters of the base case to be faithfully represented Significantly complicates the simulation of the flowsheet and increases both capital and utility costs. Creates a high pressure fourth column.

The base case specifies five product streams:

    1. Pure C3
    2. High grade C4
    3. Predominantly 1-hexene
    4. 99% pure 1-heptene
    5. Predominantly C8 and heavies

In order to stay within the parameters of base case, the final solution in became the only option considered, adding a fourth column to separate from C4. This fourth column adds significant capital and utility cost to the process. In addition, the fourth column operates at a high pressure of 15 bar, necessitating more expensive equipment.

Column Configurations

When optimizing the columns, it is important to study the order of the separations. Changing the split order critically changes column size, condenser and reboiler duties, and pumping power. By adding a fourth column, optimizing the process became much more complex. The number of combinations of column order for three columns is 5, but for four columns, the number of possible configurations increases to 14. These 14 configurations can be classified by the first split:

Class A C3 – C4 split 5 Configurations
Class B C4 – C6 Split 2 Configurations
Class C C6 – C7 Split 2 Configurations
Class D C7 – C8 Split 5 Configurations

In order to find the best configuration, it is necessary to simulate and optimize all 14 configurations for cost using computation-intensive rigorous calculations. In order to shorten the time involved, not all 14 configurations were fully optimized. Instead, the 14 columns were set up in Hysys using shortcut columns, and these were optimized for pressure and temperature (see the next section, Optimization Methodology, on how that was accomplished). The shortcut methodology solves for minimum reflux ratio as well as condenser and reboiler duties. By specifying the reflux ratio to be 150% of the minimum, the shortcut column solves for the number of trays. Each shortcut column was then costed in CapCost. The sum total capital cost for these columns is shown in Table 5.

Configuration

Class

Cost

Rank

1

A

$ 856,242.00

3

2

D

$ 1,048,842.00

11

3

B

$ 856,803.00

4

4

B

$ 928,258.00

5

5

C

$ 995,873.00

10

6

C

$ 935,695.00

6

7

D

$ 1,060,753.00

13

8

D

$ 1,054,388.00

12

9

D

$ 830,099.00

2

10

A

$ 778,520.00

1

11

A

$ 942,535.00

8

12

A

$ 1,120,191.00

14

13

D

$ 965,784.00

9

14

A

$ 937,510.00

7

The five cheapest configurations shown in Table 5 were then fully optimized for capital and utility costs using more rigorous distillation columns found in Hysys. Configurations 10, 9, 1, 3, and 4 rank as the five cheapest, representing two class A configurations, two class B configurations, and one class C configurations.

Optimization Methodology

Optimizing several columns involves varying many variables and seeing how they effect the final cost. For each column, the variables that could be changed were:

1. Column Pressure

4. Light Key mole fraction in Bottoms

2. Number of Trays

5. Heavy Key mole fraction in Distillate

3. Reflux Ratio

6. Feed Stage

Since finding the optimum values for all 6 variables for 4 columns for 14 different configurations would be a time-consuming task, several heuristics were used to guide in the optimization, design, and costing of the cases:

    1. Minimizing the pressure in a column will improve the separation of compounds since ideality is reached at lower pressures. Similarly, lower pressures will decrease material cost and decrease pump power.
    2. Lowering the pressure in a column will decrease the temperature at which column stages will operate. This will simultaneously increase cooler duty and decrease reboiler duty, a cost-effective tradeoff since steam for a reboiler is significantly more expensive than cooling water for a cooler.
    3. The condenser for each column will use cooling water as the heat transfer medium. Cooling water can only be taken from 30° C to 40° C. Therefore, distillate can only be taken down to about 45° C without the heat exchanger becoming too large. Therefore, the pressure can be lowered until this condenser condition is met.5
    4. Similarly, the reboiler uses low-pressure steam at 160° C. Care should be taken not to exceed this temperature in the liquid bottoms.
    5. For any desired separation, the reflux rate and the number of trays share an inverse relationship. Increasing the reflux ratio will decrease the number of trays, therefore reducing the capital cost of the column. However, increased reflux will increase the flow in the columns and so increases the condenser and reboiler duties and utility costs. The optimal reflux ratio is usually in the range of 1.2–1.5 of the minimum reflux ratio.5
    6. To roughly find the diameter of a column, the reboiler duty of the column can be used as a rough correlation, where Duty = .4× (Diameter)2. The Duty should be in MMBtu/hr, and the Diameter will be found in feet. This heuristic was used to size the shortcut columns.2
    7. This estimation is used for bubble cap trays and safely overestimates sieve tray sizes.2 The diameter calculated by this method was used in sizing the full distillation column cases.

    8. Each tray section is taken to have a height of 24 inches, a standard tray height.2
    9. Correlations found by Branan estimate the tray efficiency to be anywhere from 93%-78% efficient. To be conservative, the tray efficiency was set to be 80%2.
    10. The feed stage for a column will change the temperature profile of the column as well as the reflux ratio. The feed stage chosen will be the one that minimized the reflux ratio.
    11. To make precise, yet conservative estimate of the diameter of any column tray, use the following formula:

where vmax = maximum velocity

DT = diameter of tray

C = constant dependent on surface tension » 550

V = vapor volumetric flowrate

r v,L = density of vapor and liquid

The Optimal Column Configuration

After setting up several different cases in Hysys using full distillation columns, it became apparent that the cheapest configuration would have the added fourth column depropanizer as the last column in its chain. Therefore, all class A configurations were found to be enormously expensive, due the enormous pumping requirements since the whole feed is pumped to 15 bar. After several runs, it was found that a simple modification on the base case would be the best way to separate heptenes. Shown in Figure 5 is a PFD representing the optimal case, configuration 3, a class B configuration. It is similar to the base case shown earlier, except that the partial condenser found in the first column, T-501, has been turned into a full condenser, and the distillate product is sent to a new column, T-504. T-504 will create a 90% pure propane stream, and fixes the design error in the base case. For effective C3-C4 separation, T-504 operates at 15 bar, a large increase over the 5.5 bar of T-501. In order to bring the T-504 feed up to stage pressure, a new pump was also added, P-508. Much of the cost of separating propane from C4 can be found in this new pump.

Optimized Column Design Specifications

The capital cost for the columns is where most of the money between the base case and the optimized case is saved. The optimized case has much smaller column heights than the base case, though it does not have significantly fewer trays. Since the costing equations weigh heavily towards vessel size and not internals, this saves tremendously on capital costs. Similarly, the pressures in each column were also lowered, saving on pump requirements and material thickness. However, the addition of the fourth column added a large cost. It is at a significantly higher pressure than the other columns, and it has a moderate number of trays as well. Due to its placement, though, it has low associated condenser and reboiler duties, which help to minimize costs. Table 7 compares the optimized case columns to the base case.


Pressure (bar)

Number of Actual Trays

Feed Stage

Height (m)

Diameter (m)

Reflux Ratio

Condenser Duty (MJ/hr)

Reboiler Duty (MJ/hr)

Base Case

T-501

5.50

20

11

20.7

1.05

0.539

3577

1251

T-502

2.5

38

20

26.0

1.10

3.112

2630

2184

T-503

1.5

41

24

27.3

.90

1.699

2146

2026

Optimized Case

T-501

5.0

18

12

8.5

1.09

0.984

4525

1580

T-502

1.5

29

15

14.0

0.93

2.70

2274

1776

T-503

1.0

30

15

14.6

1.05

2.14

2537

2380

T-504

15.0

25

14

12.2

0.47

25.5

1095

1934

Optimized Heat Exchanger Design Specifications

In most cases, the sizes and duties of the heat exchangers did not change appreciably. The most significant change is in the T-501 condenser E-504, which was converted from a partial condenser to a total condenser, thereby increasing its size and duty.

Shell Side

Tube Side


Type

Duty (MJ/hr)

Area (m2)

Pressure (bar)

Max. Temp (C)

Pressure (bar)

Max. Temp. (C)

Base Case

E-503

Float. Head

1251

32.1

6.0

160

5.8

151

E-504

Fixed TS

3577

128.5

5.0

45

4.0

40

E-505

Float. Head

2184

21.1

6.0

160

2.5

135

E-506

Fixed TS

2630

20.0

2.0

78

4.0

40

E-507

Double Pipe

146

2.1

2.0

78

4.0

40

E-508

Float. Head

2026

75.3

6.0

160

2.0

154

E-509

Fixed TS

2146

9.7

1.5

107

4.0

40

E-510

Double Pipe

372

3.9

1.3

107

4.0

40

E-511

Double Pipe

330

2.4

1.7

154

4.0

40

Optimal Case

E-503

Float. Head

1580

49.46

6.0

160

5.8

151

E-504

Fixed TS

4525

158.07

5.5

48

4.0

40

E-505

Float. Head

1776

30.61

6.0

160

2.5

137

E-506

Fixed TS

2274

18.65

2.0

85

4.0

40

E-507

Double Pipe

136

2.09

2.0

78

4.0

40

E-508

Float. Head

2380

34.29

6.0

160

1.60

145

E-509

Fixed TS

2537

12.89

1.50

110

4.0

40

E-510

Double Pipe

381

4.05

1.50

110

4.0

40

E-511

Double Pipe

298

2.44

1.60

145

4.0

40

E-512

Float. Head

1095

12.12

6.0

160

15.1

91

E-513

Fixed TS

1934

23.51

15.0

56

4.0

40

Optimized Pump Design Specifications

The purpose of the pumps is to make sure that the column feeds arrived above stage pressure for their respective stages. The pumps add enough pressure to the flow to make the fluids travel uphill and prevent backflow from the feed stage. Turton, et al approximated pumping requirements by increasing the head by a bar for every 15 trays that were climbed.5 All pumps were specified with a 40% adiabatic efficiency. The pumps in the base case had significantly higher power requirements than the pumps shown in the optimized case. This may be due to simulation differences, or Turton may have added power for safety concerns.


Shaft Power (kW)

Pressure In (bar)

Pressure Out (bar)

Temperature (C)

Base Case

P-503

2.75

5.50

7.55

45

P-504

0.66

2.50

4.00

151

P-505

2.15

2.00

4.47

78

P-506

1.93

1.50

4.00

107

Optimal Case

P-503

0.6822

5.50

7.55

45

P-504

0.3550

2.50

4.00

137

P-505

0.7454

2.00

4.50

78

P-506

0.8917

1.50

4.00

110

P-507

0.5521

15.00

17.00

51

P-508

4.855

5.50

16.00

46


Reflux Vessels

The reflux drums used in the base case were not changed for the optimum case. For the fourth column, an average sized vessel, V-505, was added for costing purposes.


Length (m)

Diameter (m)

Pressure (bar)

V-502

3.30

1.10

5.50

V-503

2.85

0.95

2.00

V-504

2.75

0.92

1.50

V-505

3.00

1.00

16.00

Cost Analysis

Methodology

The methodology used to calculate the cost of the base case and our optimized cases is described in appendix B.

Economic Optimization of the Cases

The optimal tray configuration was determined through a process of trial and error by varying the number of trays for each column beginning with the first column and working our way to the last one. Figure 6 shows an example of how the overall cost of the plant can be affected as the number of trays is changed. The minimum of each curve represents the best balance of capital and utility costs for that column. This was accomplished through the use of an Excel spreadsheet set to cost inputted data using the CapCost equations. The spreadsheet was interfaced with Hysys via Visual Basic and OLE automation such that excel could essentially "grab" data from Hysys and tabulate the input in an Excel format.

Charts similar to those as Figure 6 were made for several of the column configurations. The minimum overall plant cost for these configurations is shown is Figure 7 and Table 11. Though the base case is the cheapest case, it is flawed, and so configuration 3 "wins" out over the rest of the cases. Configuration 1 is a class A configuration, and shows just how much the utility cost is affected by having the depropanizer first.

Base Case

Configuration 3

Configuration 4

Configuration 1

Capital Cost

$1,230,647.56

$1,040,707.10

$1,062,318.34

$1,406,742.08

Utility Cost

$1,141,681.18

$1,425,154.71

$1,459,454.97

$2,997,921.63


Calculated Cost

Capital Costs

The majority of the capital costs for both the base case and the optimized case is found in the columns. As seen in Figure 7, the capital cost for the optimal case was similar to the capital cost for the base case, even though the optimal case had an extra distillation column with supporting operations. This is due to optimizations on the columns themselves – decreased trays, thinner columns, and better reflux ratios that decreased heat exchanger sizes. The optimal case also includes two extra pumps, one of which is a high pressure pump, greatly adding to cost. The optimal case similarly adds a reflux drum for the fourth column and two heat exchangers acting as a condenser and a reboiler, respectively. These accessories to the fourth column add significant expense, due their high pressure, high flowrate nature.

As can be seen from Figure 8 - Division of capital cost for the base case, the columns are the most expensive portion of the base case capital cost comprising nearly 70% of the total capital cost. However, the costs are more evenly spread out in the optimal case, shown in Figure 9.

Table 12 shows the costs for the various individual operations for various configurations. Each of the configurations shown saves significantly on the cost of the first three columns, T-501 through T-503, however, T-504 adds back much of the saved cost. Most of the other operations are similar in price, except for configuration 10 where the installed cost of the high pressure pump negatively affects the overall capital cost picture.

Equipment Type

Base Case

Configuration 3

Configuration 4

Configuration 10

Columns
T-501 $ 239,460.18 $ 107,481.79 $ 121,075.19 $ 137,896.85
T-502 $ 307,872.29 $ 151,174.47 $ 157,411.40 $ 197,813.17
T-503 $ 303,402.99 $ 167,515.81 $ 128,370.89 $ 204,496.60
T-504 $ - $ 138,685.52 $ 175,929.72 $ 117,863.35
Heat Exchangers
E-503 $ 25,994.96 $ 32,126.24 $ 31,150.49 $ 36,522.70
E-504 $ 45,003.92 $ 51,082.68 $ 50,737.97 $ 40,560.52
E-505 $ 21,522.84 $ 25,423.41 $ 24,301.75 $ 25,095.17
E-506 $ 16,473.47 $ 15,935.54 $ 14,117.84 $ 15,971.81
E-507 $ 2,154.09 $ 2,153.49 $ 2,153.96 $ 2,149.80
E-508 $ 40,139.63 $ 26,817.26 $ 26,313.57 $ 33,964.33
E-509 $ 11,887.10 $ 13,454.90 $ 18,729.06 $ 12,799.82
E-510 $ 2,236.02 $ 2,241.21 $ 2,259.18 $ 2,241.23
E-511 $ 2,171.51 $ 2,173.54 $ 2,172.75 $ 2,173.85
E-512 $ - $ 17,466.87 $ 17,579.10 $ 30,907.55
E-513 $ - $ 18,129.03 $ 17,772.19 $ 52,371.28
Pumps
P-503 A/B $ 48,052.39 $ 30,393.40 $ 30,175.67 $ 30,093.58
P-504 A/B $ 30,082.51 $ 24,931.14 $ 29,930.80 $ 24,929.33
P-505 A/B $ 44,164.38 $ 31,247.09 $ 27,629.03 $ 30,494.67
P-506 A/B $ 42,580.13 $ 32,195.41 $ 34,187.15 $ 30,586.89
P-507 A/B $ - $ 32,697.39 $ 32,959.36 $ 64,987.91
P-508A/B $ - $ 68,927.78 $ 68,908.13 $ 348,370.55
Vessels
V-503 $ 17,462.20 $ 17,462.20 $ 17,462.20 $ 17,462.20
V-504 $ 15,217.90 $ 15,217.90 $ 15,217.90 $ 15,217.90
V-505 $ 14,769.04 $ 14,769.04 $ 14,769.04 $ 14,769.04
V-506 $ - $ 14,469.80 $ 14,469.80 $ 14,469.80
Total $1,230,647.55 $1,054,172.90 $1,075,784.13 $1,504,209.90

Utility Cost

The utility costs were calculated over a ten-year period. All the dollar amounts shown below represent the net present value of the utilities using a 7% discount rate.

For the base case, the reboiler steam comprise nearly 88% of the total utility cost over the ten year period the plant is assumed to exist.

Over 90% of the cost for the optimal case is also due to the reboiler steam. The overall utility costs are increased because of the additional column, and its reboiler and condenser. Oddly, the pump costs went down, even though an extra high-pressure pump was added. It seems that the base case overestimated the pumping requirements by a large factor.

A breakdown of the utility costs with regards to heat exchangers and pumps for each configuration is shown in Table 13.

Equipment Type

Base Case

Configuration 3

Configuration 4

Configuration 10

Heat Exchangers
E-503 $ 231,794.39 $ 292,836.12 $ 282,473.41 $ 469,591.49
E-504 $ 33,452.24 $ 42,313.33 $ 41,819.83 $ 30,566.56
E-505 $ 404,667.42 $ 329,110.46 $ 368,210.32 $ 315,510.78
E-506 $ 24,595.86 $ 21,267.70 $ 16,269.97 $ 20,513.82
E-507 $ 1,365.40 $ 1,275.50 $ 1,271.84 $ 1,187.51
E-508 $ 375,392.03 $ 292,836.12 $ 282,473.41 $ 469,591.49
E-509 $ 20,069.48 $ 23,724.08 $ 36,208.66 $ 21,239.03
E-510 $ 3,478.96 $ 3,560.66 $ 4,779.78 $ 3,569.72
E-511 $ 3,086.17 $ 2,784.26 $ 2,768.55 $ 2,790.39
E-512 $ - $ 358,388.88 $ 364,549.82 $ 985,232.72
E-513 $ - $ 10,241.79 $ 10,559.64 $ 78,975.96
Pumps
P-503 A/B $ 16,073.82 $ 3,987.42 $ 3,896.31 $ 3,862.29
P-504 A/B $ 3,857.72 $ 2,074.78 $ 3,795.37 $ 2,074.27
P-505 A/B $ 12,566.80 $ 4,357.10 $ 2,924.22 $ 4,030.23
P-506 A/B $ 11,280.90 $ 4,791.33 $ 5,786.01 $ 4,069.46
P-507 A/B $ - $ 3,226.94 $ 3,312.08 $ 25,591.17
P-508A/B $ - $ 28,378.23 $ 28,355.76 $1,491,422.46
Total $1,141,681.17 $1,425,154.71 $1,459,454.99 $3,929,819.34

References

1). Barton, Allan. CRC Handbook of Solubility Parameters and Other Cohesion Parameters. CRC Press: Boca Raton, Florida. 1991.

2). Branan, Carl R. ed. Rules of Thumb for Chemical Engineers. Gulf Publishing Company: Houston, Texas. 1994.

3). Brian, P. L. Staged Cascades in Chemical Processing. Prentice Hall, Inc.: Englewood Cliffs, NJ. 1972.

4). Chauvel, A., P. Leprince, Y. Barthel, C. Raimbault, and J-P Arlie. Manual of Economic Analysis of Chemical Processes, translated by R. Miller and E. B. Miller, McGraw-Hill: New York. 1996.

5). Turton, Richard; et al. Analysis, Synthesis, and Design of Chemical Processes. Prentice Hall: Upper Saddle River, New Jersey. 1998.

6). Hyprotech Corporation. Hysys Reference Guide 1. 1997.

7). Gas Processors Suppliers Association. GPSA Engineering Data Book, Volume 2. GPSA: Tulsa, Oklahoma. 1994.

Appendix A – Stream Tables

Product Streams

Name

T-501 Feed

T-501 Bottoms Product

T-502 Bottoms Product

T-503 Feed

T-502 Bottoms Product

C8+ Product

T-501 Distillate Product

Temperature (C)

103

151.023

136.4578

136.5687

144.1429

45

45.25983

Pressure (kPa)

580

580

250

400

160

157

550

Molar Flow (kgmole/hr)

178.11

58.39271

36.42461

36.42461

10.51335

10.51335

119.7173

Mass Flow (kg/hr)

12436.24

5628.974

3806.557

3806.557

1266.376

1266.376

6807.261

Volumetric Flow (m3/hr)

19.86033

8.130304

5.403957

5.403957

1.750949

1.750949

11.73003

Component Mole Fractions

Propane

0.019988

0

0

0

0

0

0.029734

I-Butane

0.165291

0.002375

0

0

0

0

0.244755

n-Butane

0.193195

0.009519

0

0

0

0

0.282784

I-Butene

0.046432

0.000986

0

0

0

0

0.068599

1-Butene

0.252316

0.006

0

0

0

0

0.372458

1-Hexene

0.119084

0.359805

0.010003

0.010003

0

0

0.001671

1-Heptene

0.148953

0.454337

0.722321

0.722321

0.080002

0.080002

0

1-Octene

0.041604

0.126899

0.203434

0.203434

0.697424

0.697424

0

1-Undecene

0.013138

0.040073

0.064242

0.064242

0.222574

0.222574

0

Water

0

0

0

0

0

0

0

Name

T-503 Distillate Product

T-504 Distillate Product

Hexene Product

Heptene Product

T-504 Feed

T-504 Bottoms Product

T-502 Distillate Product

Temperature (C)

108.9934

50.26205

45

45

46.24591

91.10723

77.55444

Pressure (kPa)

150

1500

197

147

1600

1510

200

Molar Flow (kgmole/hr)

25.91127

2.944404

21.9681

25.91127

119.7173

116.7729

21.9681

Mass Flow (kg/hr)

2540.18

137.1371

1822.418

2540.18

6807.261

6670.124

1822.418

Volumetric Flow (m3/hr)

3.653008

0.26319

2.726346

3.653008

11.73003

11.46684

2.726346

Component Mole Fractions

Propane

0

0.812341

0

0

0.029734

0.01

0

I-Butane

0

0.099989

0.006312

0

0.244755

0.248405

0.006312

n-Butane

0

0.011403

0.025301

0

0.282784

0.289627

0.025301

I-Butene

0

0.014922

0.002621

0

0.068599

0.069952

0.002621

1-Butene

0

0.061345

0.015949

0

0.372458

0.380302

0.015949

1-Hexene

0.014061

0

0.939801

0.014061

0.001671

0.001713

0.939801

1-Heptene

0.982939

0

0.01

0.982939

0

0

0.01

1-Octene

0.003

0

0

0.003

0

0

0

1-Undecene

0

0

0

0

0

0

0

Water

0

0

0

0

0

0

0

Utility Streams

Name

E-504 In

E-504 Out

E-506 In

E-506 Out

E-507 In

E-507 Out

E-509 In

E-509 Out

Temperature (C)

30

40

30

40

30

40

30

40

Pressure (kPa)

101.325

101.325

101.325

101.325

101.325

101.325

101.325

101.325

Molar Flow (kgmole/hr)

5821.274

5821.274

2925.912

2925.912

175.4777

175.4777

3263.85

3263.85

Mass Flow (kg/hr)

104870.8

104870.8

52710.6

52710.6

3161.249

3161.249

58798.59

58798.59

Volumetric Flow (m3/hr)

105.0825

105.0825

52.81698

52.81698

3.167629

3.167629

58.91725

58.91725

Name

E-510 In

E-510 Out

E-511 In

E-511 Out

E-513 In

E-513 Out

Temperature (C)

30

40

30

40

30

40

Pressure (kPa)

101.325

101.325

101.325

98.325

101.325

1

Molar Flow (kgmole/hr)

489.8607

489.8607

383.0693

383.0693

24.59798

24.59798

Mass Flow (kg/hr)

8824.891

8824.891

6901.033

6901.033

443.1351

443.1351

Volumetric Flow (m3/hr)

8.8427

8.8427

6.914959

6.914959

0.444029

0.444029

Name

E-503 In

E-503 Out

E-508 Out

E-508 In

E-512 Out

E-512 In

E-505 In

E-505 Out

Temperature (C)

160

160

160

160

160

160

160

160

Pressure (kPa)

617.468

617.468

617.4694

617.468

617.4694

617.468

617.468

617.4694

Molar Flow (kgmole/hr)

41.67806

41.67806

62.767

62.767

51.0079

51.0079

46.84083

46.84083

Mass Flow (kg/hr)

750.8345

750.8345

1130.754

1130.754

918.9124

918.9124

843.8423

843.8423

Volumetric Flow (m3/hr)

0.75235

0.75235

1.133036

1.133036

0.920767

0.920767

0.845545

0.845545

Appendix B – Cost Methodology

The capital cost information was obtained using the equations and figures presented in appendix A of Turton, et al. These equations describe the relationships used in the capital equipment costing program Capcost5. These equations were then entered into a spreadsheet where we could change the definitive parameters with ease. This will allow us to optimize our five best configurations quickly and efficiently.

Capital Costs

The standardized equations for each piece of equipment are as follows:

Where Cp is the purchased cost for base conditions, i.e. ambient pressure and carbon steel construction, A is the size or capacity parameter for each particular piece of equipment, and K1, K2, and K3 are constants dependent on equipment type5.

FP is the pressure factor and is related to P, pressure in bar gauge, and constants C1, C2, and C3. FP contributes to cost by increasing cost if pressure deviates from atmospheric pressure and is always greater than unity.

C° BM is the bare module cost of the equipment and is defined as the direct and indirect cost of each unit. C° BM is related to purchased cost and the bare module cost factor, F° BM. The bare module cost factor is a multiplicative factor that accounts for costs associated with the installation of equipment as well as the materials of construction and operating pressure. It is related to material factor, FM, and pressure factor as indicated above. The bare module cost is the cost of the unit after all of the necessary factors are taken into consideration5.

The three equations listed above are more or less consistent for each of the units costed. However, there are circumstances when the equation for a particular piece of equipment was slightly different. When this is the case and another formula was used, it is noted in the report. All of the constants and variables are listed in each section under the appropriate type of equipment.

The size parameter needed to cost a heater is the heat transfer (m2). The constants are listed in the book and there are no deviations from the standardized equations5.

The size parameter is the height or length of the vessel in meters. The constants K1, K2, and K3 depend on the diameter of the vessel. Since the constants were not given for every possible diameter and our vessels did not correspond exactly to the diameters given, we linearly fit our diameter to get the bare module cost. Also, there is a difference in cost if the vessel is horizontal or vertical. Moreover, the pressure factor is not related to pressure as above; rather, it is related to pressure as follows:

Where

FP = 1.00 when –0.5 < P < 3.7 barg

FP = 1.25 when P < -0.5 barg

In order to calculate the cost for a distillation column both the internal and external costs are taken into consideration. The internal cost consists of the sieve trays and the external cost consists of the vessel that contains the trays. The vessel is priced the same as above and as with the vessels we were forced to linearly fit some of our data. The size parameter for the sieve trays is the diameter of the vessel in meters and is related to CP by the equation given below5.

And bare module cost is related to purchased cost by

The capacity parameter used to price a pump is the shaft power in kW. All of our pumps were centrifugal and therefore the same constants were used throughout. The pressure factor varies slightly from the standardized pressure factor equation and is given below5. All other equations held for pricing of the pump.

Utility Costs

The utility costs were calculated using the utility information and formulas given in the text5 on page 87. The basic formula used to calculate the yearly cost for each unit was

Yearly cost = Duty * Cost of utility used * time * Stream Factor (SF)

Where duty is heat in the case of heat exchangers and electric power for pumps and SF is the percentage of the year that the plant is open. The duty values are given in table 3.4 and are in the units $/GJ or $/kWh. SF is taken to be 0.95 as suggested by the book5.

Due to the efficiency associated with a pump, output power is not the same as the power supplied to the pump and therefore one must compensate for this to calculate the actual electric power supplied to the pump. Hence,

Electric Power = Output Power / efficiency

Once you calculate the electric power, you insert the answer into the yearly cost equation and calculate the yearly cost. The price of electricity is $0.06/kWh5.

To calculate the utility cost for a heat exchanger the duty in GJ/hr is substituted into the yearly utility cost equation. The two types of heating/cooling medians used in our project are low pressure steam and cooling water costing $3.17/GJ and $0.16/GJ, respectively5.

Once the yearly utility cost per unit is calculated, this value must be adjusted to correspond to the total operating cost for the assumed life of the plant, which we set to be 10 years. We accomplished this by doing an incremental economic analysis. The theory behind an incremental economic analysis is that the cost of utility each year remains constant even though inflation continues to rise. Therefore, one is paying the utility companies the exact same amount of money each year, however, this money is worth more due to inflation, so the utilities cost less. Using a 7% discount rate, we solved the following equation given in the book to calculate our discount factor.

Using n = 10 years and i = 0.07 we calculated a discount rate of 7.0235. This number multiplied by the yearly cost results in the accumulated cost over a ten year period5.

Appendix C – Column Configurations

Configuration 1

Configuration 2

Configuration 3

Configuration 4

Configuration 5

Configuration 6

Configuration 7

Configuration 8

Configuration 9

Configuration 10

Configuration 11

Configuration 12

Configuration 13

Configuration 14