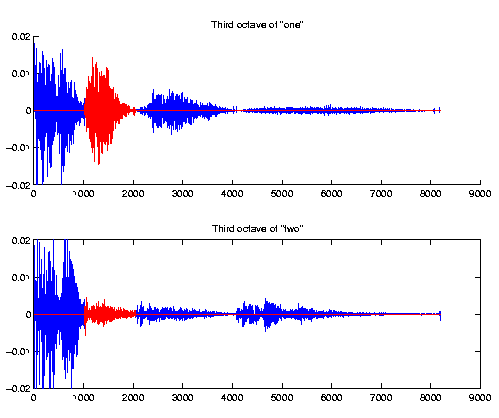
The very first step to our project is, of course, making templates of the digits to compare input signals with. For each digit, we recorded 21 samples from seven different sources -- all males, and wavelet transform each one of them. Then we take the average of the coefficients as our templates.
Daubechies wavelet of length 32 is used in this project; the level of the transform is seven (a level is just the number of octaves the signal is projected onto). These numbers are obtained by trial-and-error, as suggested by Dr. Sidney Burrus. The wavelet transform function we used can be found at the Rice Wavelet Toolbox for Matlab.
We made all the recordings of sounds on SGI computers. The program Soundeditor is used for the recording and cleaning of the signals. For every recording of a sound, we manually remove those parts of the file which do not correspond to speech signals -- noises, then normalize it so that the volume of the speaker does not affect the result. The parameters we used are
Sample rate: 48000 Hz
Channel: 1
Sample bit width: 16
The program Soundfiler is then used to convert the output file of Soundeditor to a format readable by Matlab. Parameters for Soundfiler:
File format: NeXT/Sun
Rate: 8K
Channel: Mono
Format: Mulaw
At first, we tried to compare the entire input signal to the templates. The very first approach we took was the mean square difference comparison, where we subtract the template from the input signal, square the remaiders, and sum up all the coefficients -- hoping that the digit which the input signal correspond to, will give the minimum value. This approach works very well with signals we made the templates out of; however, it is a complete failure with signals outside of the templates. It was then obvious that we totally under-estimated the the complexity of speech signals...
We then tried to make comparisons with other methods: comparing the absolute values of the coefficients, normalizling the signal before comparing, dot product the input signal to the templates... Among these methods, dot product gives the best result. We dot the input with each of the templates, and due to the nature of the dot product, the digit that the signal correspond to will result in the largest value. We get a success rate of about 40% with this approach.
Just when we thought we had failed, we had a divine intervention and realized that we can get more out of the wavelet transforms. We could compare the octaves of the signals instead of comparing the entire signal as a whole!
So we analysed the octaves, and found out that we can differentiate 2 and 3 from 1, 4, and 5 looking at the amplitude of the third octave. If the amplitude is small, the number is either 2 or 3; otherwise, it's 1, 4, or 5.

We then analyze other octaves to differentiate between 2 and 3, and 1, 4, and 5. For 2 and 3, we look at the second octave. We threshold the region and find the number of samples above the threshold. If the number of samples above the threshold is large, we probably have a 2, and if the number is small, the signal is likely to be a 3. Of course, there's always the chance that the number falls within the region between a 2 and a 3. In this case, we use the dot product comparison to identify the signal.
We used the same approach to identify 1, 4, and 5, only that these three numbers differ mostly in the forth octave intead of the second.
These three numbers have a similar mean value in the forth octave; however they differ in the amount they fractuates in the region. Four's coefficients fractuates with large amplitude in the forth octave, those of 1 also fractuates but with less amplitude, while 5's coefficients remain roughly constant in this region. Therefore, to distinguish between them, we threshold the first part of the octave, and count the number of samples above the threshold. The value of the threshold is picked so that 5 will only have a few coefficients above it, 4 will have many. If a definite conclusion isn't reached, the method of dot product is used again to identify the input signal.