Sensitivity Runs in Aspen
A sensitivity run in Aspen allows you to vary one element of a
system, such as the temperature of a reactor, and then view the
effects this variance has on other aspects of the system, such as the
mole composition of the reactor effluent. As part of the example of
creating a flash tank model in Aspen, we will use a sensitivity run
to show how the fraction vapor changes with the flash temperature for
fixed feed and pressure.
Since we already have a flash file created, we will use it to
create the sensitivity run. There are many steps to follow, but some
that are shown here may not be required. If you find a better or
simpler way to do this, let us know so we can correct our notes. Here
are the steps we followed:
- First create a sensitivity tool window by:
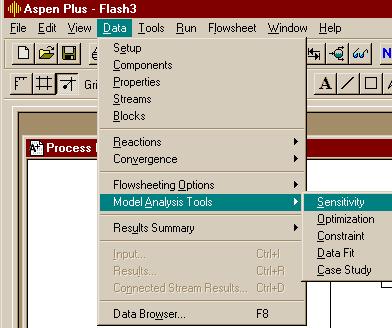
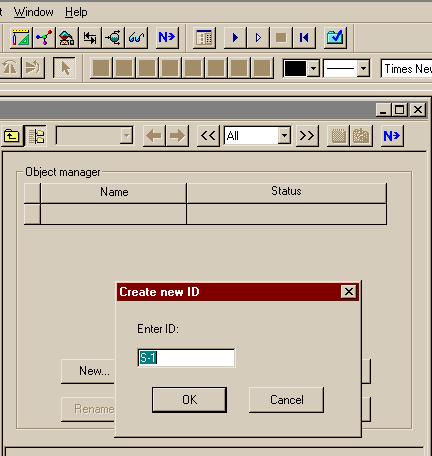
- Second, give the sensitivity run a name or accept the default
by clicking "OK" in the window. In most cases, we will
simply click on the "Next" button to go on to further steps.
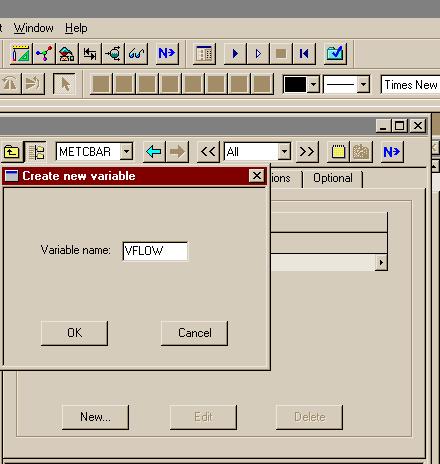
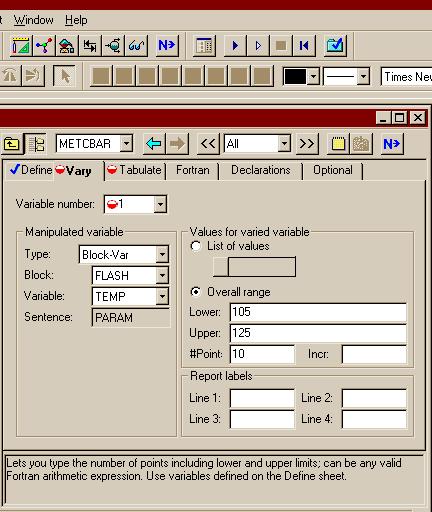
- Third, create a defined variable to be sampled. We
created the variable VFLOW by pressing the "New"
button:
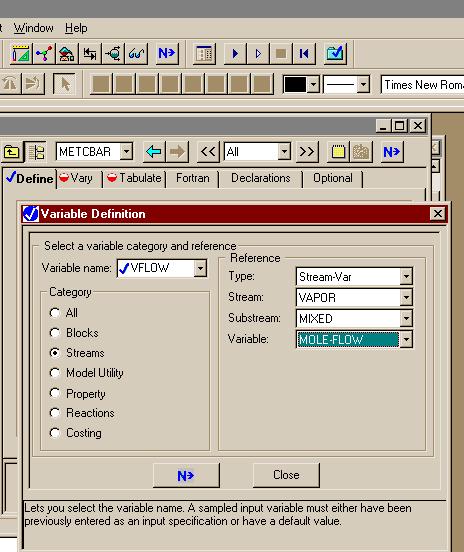
- VFLOW is in the "Streams" category, of type
"Stream-Var", in the stream "VAPOR", and it holds the "MOLE-FLOW".
The substream is mixed, but that is the default value.
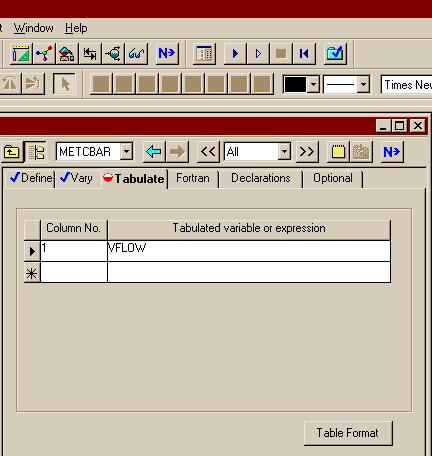
- We will tabulate "VFLOW" in the first column of out
results.
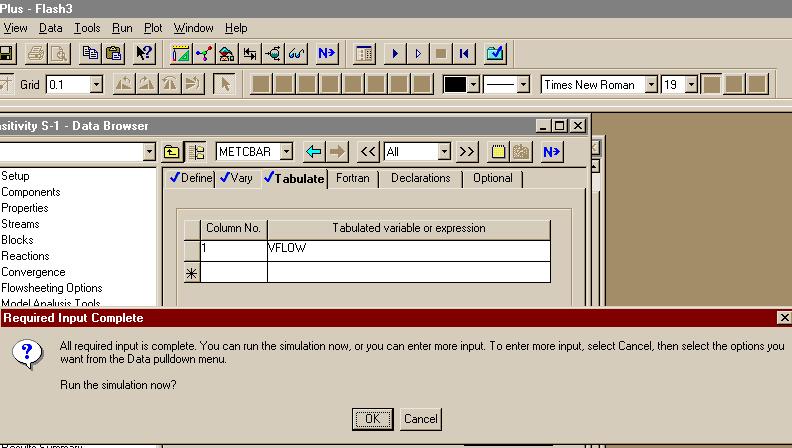
- We see (using the "Next" button again) that we have
finished setting conditions for the sensitivity run and can click
"OK" to execute the program.
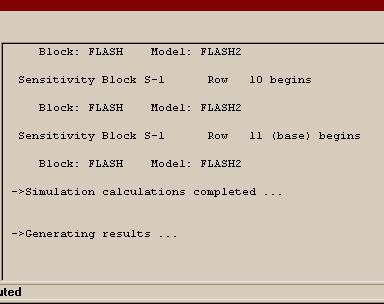
- Note that in the "Control Panel" you can see that 11
flash operations were performed.
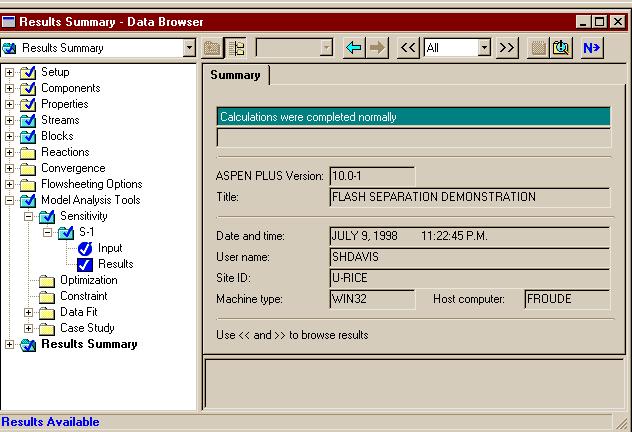
- Here is the first result window that is displayed. If
you click on the "<<" button you will find the sensitivity
results.
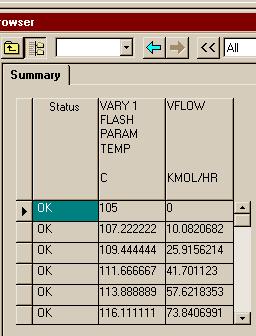
- They list the vapor flow rate for each flash temperature. Now
let's plot those results:
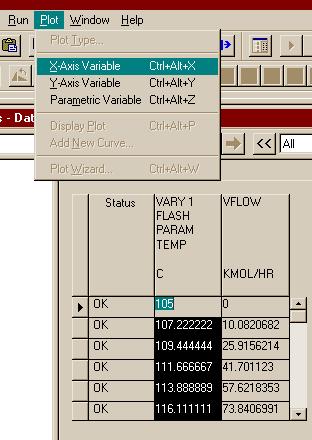
- If you a) click on the head of the "TEMP" column and
then b) use the Plot menu, you can make a plot with those
temperatures as the X-Axis Variable.
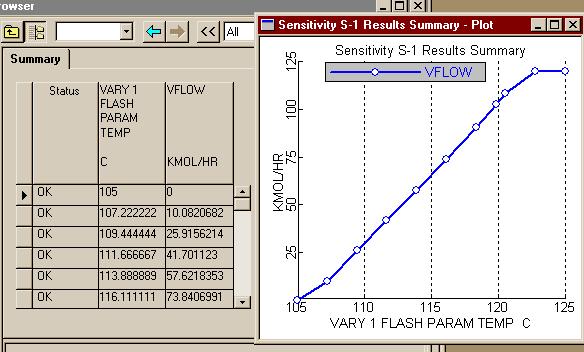
- If you a) click on the head of the "VFLOW" column and
then b) use the Plot menu, you can make a plot with the
flows as the Y-Axis Variable. Then you can use the "PLOT" menu to
display the plot as seen below.
Back to Aspen Table of Contents